Richmond Hill Capital Markets

Weekly Intelligence

Macro liquidity analysis, BTC cycle positioning, and institutional crypto strategy. Published weekly from Luxembourg.

Filter All Macro BTC MSTR ETH / BMNR GLT Updates Fed / Policy
BTC Holds $62.6K While the Liquidity Composite Quietly Turns Up
Bitcoin is trading around $62.6k — roughly half its October 2025 cycle high near $126K — chopping through the same low-$60Ks range it's tested three times this cycle. Meanwhile the RHCM Global Liquidity Tracker just posted its third consecutive weekly gain, up to 36.4/100. The price action is range-bound; the liquidity backdrop underneath it is starting to firm.
Read full analysis →
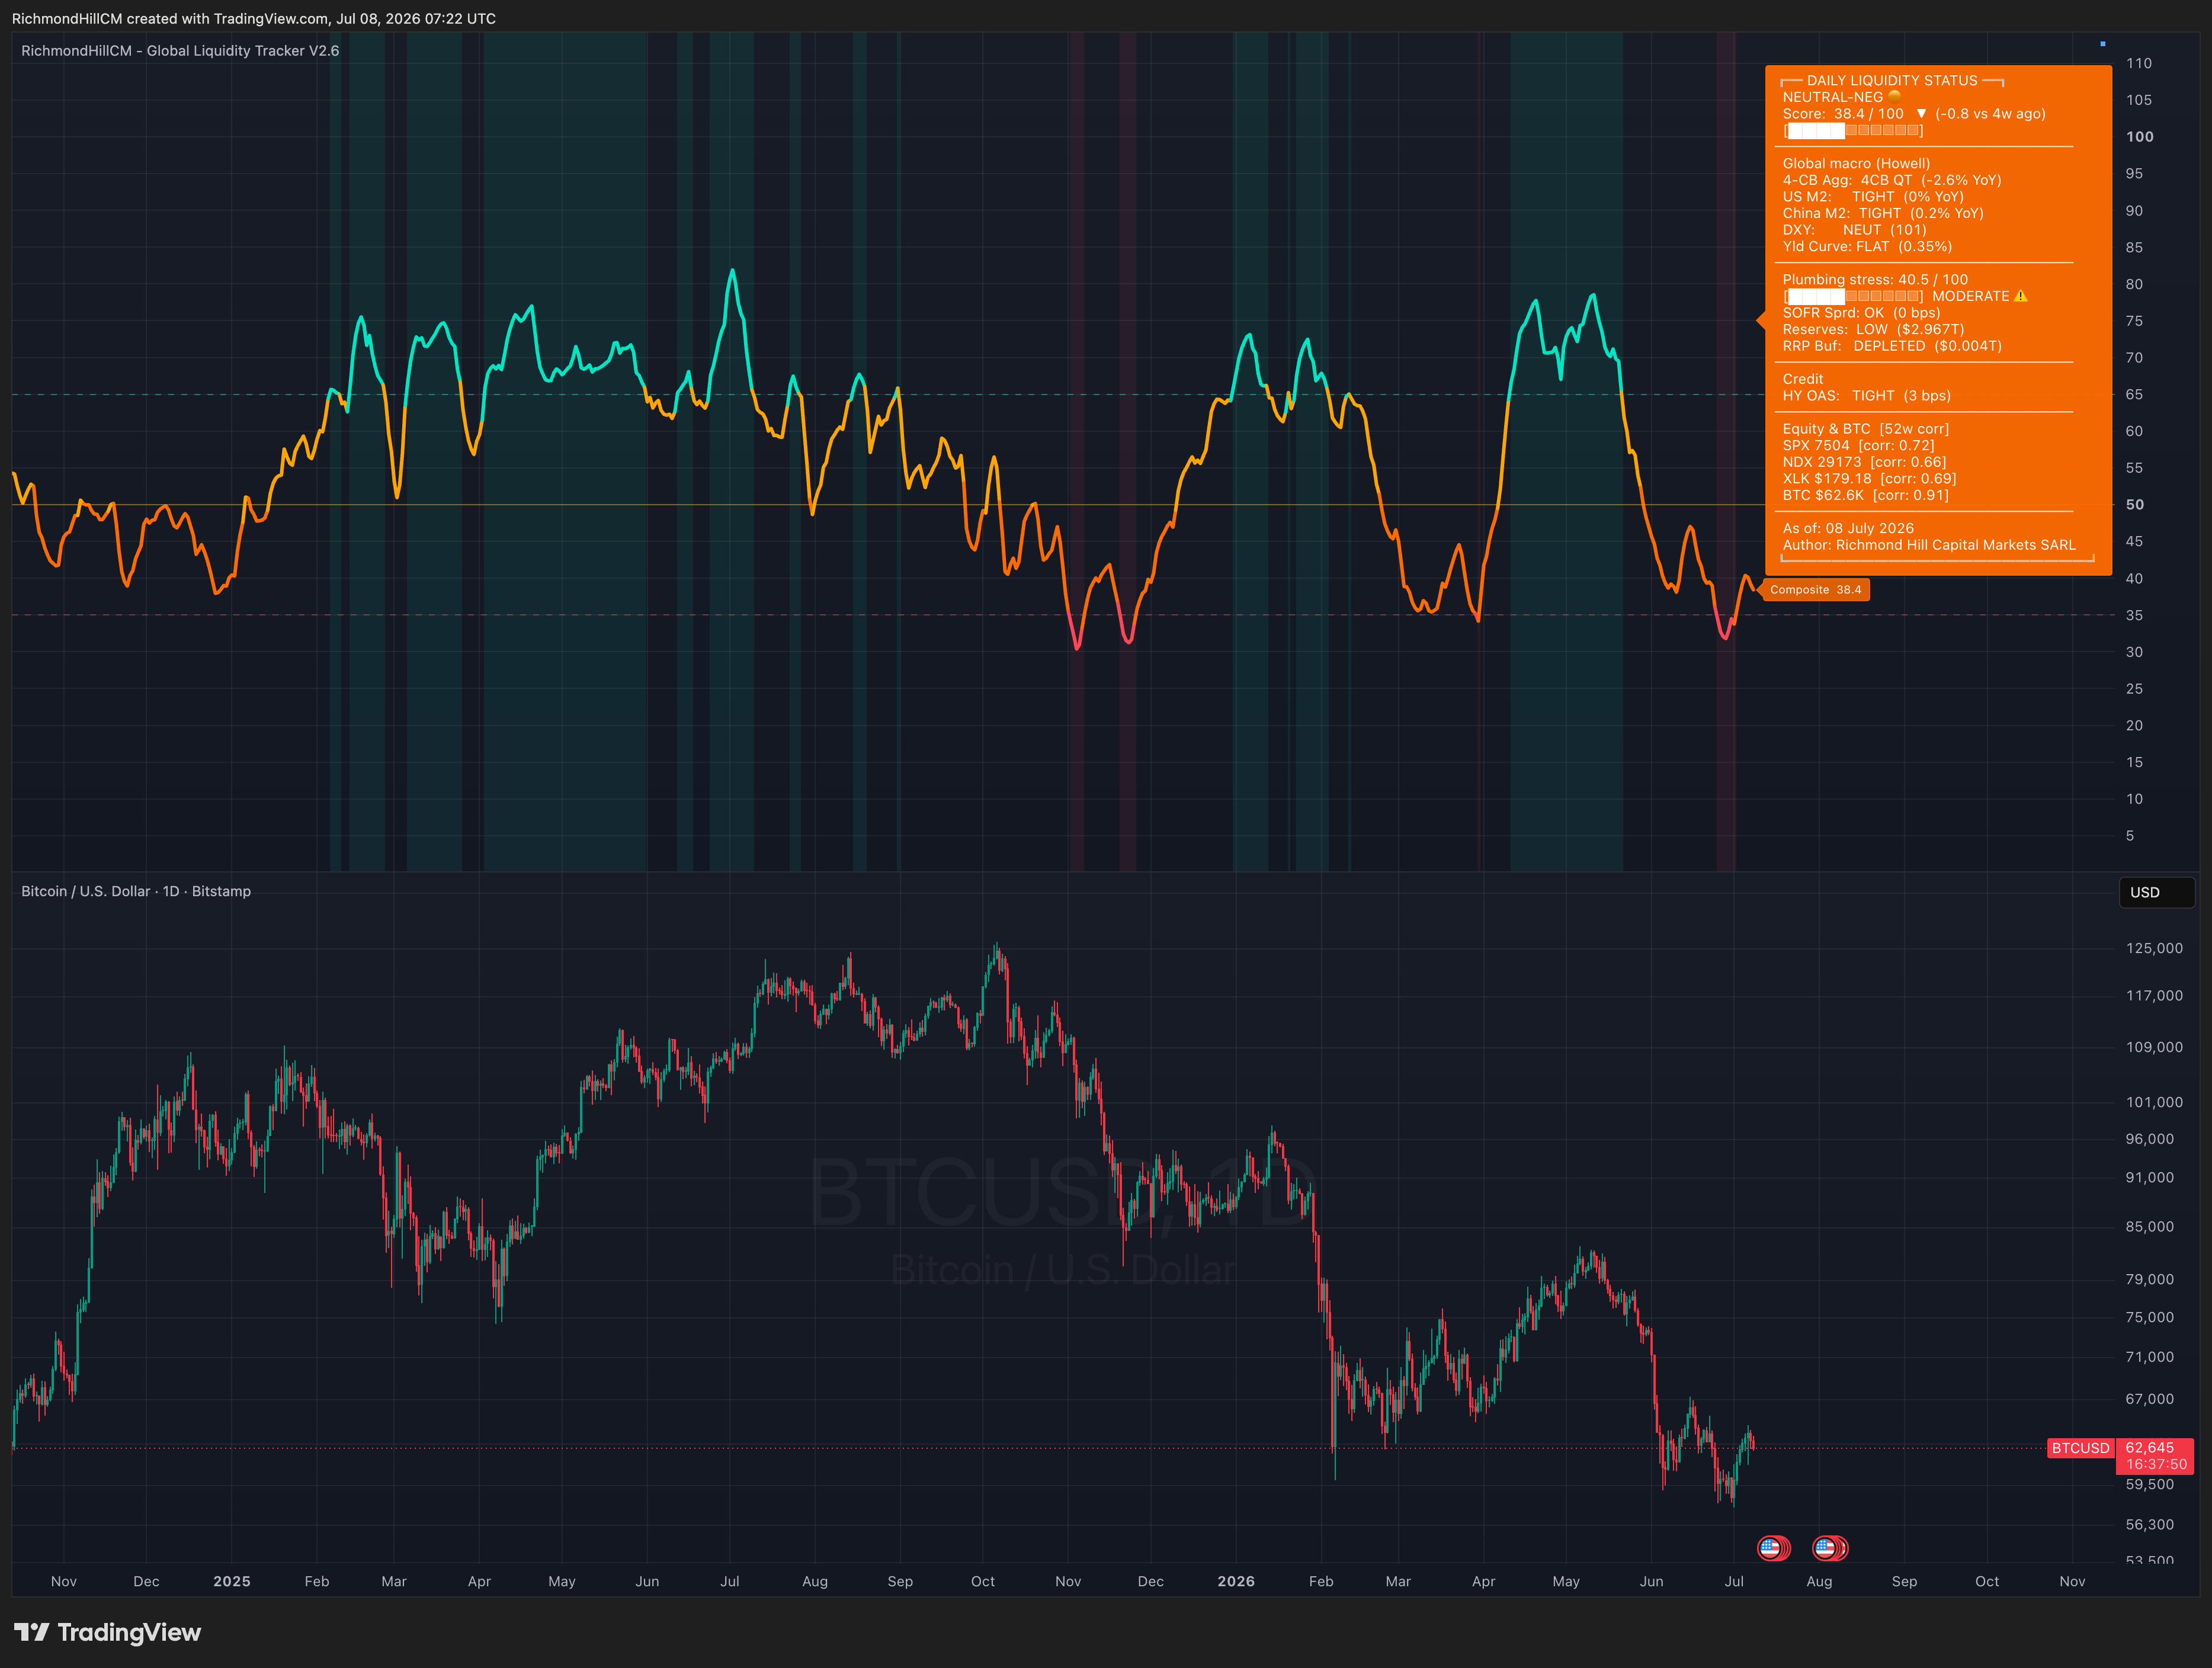
RHCM Global Liquidity Tracker vs Bitcoin (BTC/USD) daily chart, July 2026

The composite: still negative, but turning

The Global Liquidity Tracker read 36.4/100 as of July 7 — Neutral-Negative — up 3 points from four weeks ago, the third straight weekly improvement off the sub-35 floor tested in June. The 4-CB aggregate remains in contraction at −2.9% YoY, US M2 growth is essentially flat at 0.5% YoY, and China M2 is flat at 0% YoY. DXY sits neutral at 100.9 and the yield curve is flat at 0.35%. None of these are expansionary readings yet, but the direction of travel over the past month has been up, not down.

Plumbing stress hasn't eased

Plumbing stress actually ticked up to 40.1/100 (Moderate) from the 39.3 reading a month prior. SOFR spreads remain calm at 0bps, but bank reserves are still low at $2.967T and the RRP buffer is effectively exhausted at $0.003T. The shock-absorbing capacity that existed a year ago is gone — the system is currently running with almost no spare buffer, even though nothing has broken yet.

BTC: chopping through a familiar range

BTC is trading near $62.6k, well off the $126,198 cycle peak set in October 2025 but also well above the cycle's low-$60Ks floor tested repeatedly since. Looking back to 2024, the current zone lines up with the same congestion band the asset spent months building out before the 2024–2025 breakout — support that has now been retested multiple times rather than decisively broken.

Correlation still says "liquidity asset"

BTC's 52-week correlation to the liquidity composite is 0.90 — the highest of the tracked assets, ahead of XLK (0.85), SPX (0.83), and NDX (0.78), and higher across the board than the prior reading. That's the strongest evidence in the dataset that Bitcoin is still trading as a global-liquidity proxy first, independent of any short-term narrative.

What to watch

A composite that's improving while plumbing stress stays elevated is an unusual combination — reserves and the RRP buffer remain thin even as the broader macro score ticks up. A genuine reserve/RRP replenishment, a turn in the 4-CB aggregate, or a dovish signal at the July 29 FOMC would be the kind of catalyst that could push the composite decisively through 50 — historically the level where BTC has stopped chopping and started trending.

This analysis is for informational purposes only and does not constitute investment advice. All trading involves risk of loss.

Warsh's Hawkish Pivot Was the Peak — Here's Why the Dovish Turn Is Coming
The June 17 FOMC delivered the most hawkish dot plot in the Warsh era — 9 of 19 officials projecting a hike. But with oil collapsing from $126 to $78 on the Iran peace deal, the inflation data will do Warsh's work for him.
Read full analysis →

The June 17 decision

The FOMC voted 12–0 to hold rates at 3.50–3.75%. The statement was stripped to 130 words, removing all forward guidance language. But the dot plot did the damage: 9 of 19 officials see at least one hike this year. The median funds rate projection for year-end 2026 is now 3.8% — up from 3.4% in March. PCE inflation was revised up to 3.6% from 2.7%.

Why this was the peak of hawkishness

Warsh explicitly said "pencils have erasers" — nothing has been decided about rates later this year. The removal of forward guidance means the Fed will react to data rather than pre-commit. This gives Warsh maximum optionality to pivot without looking politically pressured. The hawkish dot plot establishes inflation-fighting credibility — which is precisely what gives him room to turn dovish when the data allows.

The oil transmission mechanism

Brent crude collapsed from $126 to ~$78 — a 38% decline. The Iran peace deal formal signing on June 19 in Geneva cements this. The PCE revision to 3.6% was built on $100+ oil. With Brent heading toward $70–75, gasoline prices at the pump fall within 2–3 weeks, and the July CPI print (released August 12) will show sharp disinflation.

The pivot sequence

July 29 FOMC: No dot plot meeting. Language softens — "data dependent" replaces hawkish framing. This is the easiest meeting to pivot without contradicting dots.

August Jackson Hole: Warsh's first Jackson Hole speech. Historically where Fed chairs signal major pivots — Bernanke 2010 QE2, Powell 2022 hawkish turn, Powell 2024 dovish turn.

September 15–16 FOMC + dot plot: Two clean CPI prints in hand. Dots shift from "one hike" to "one cut." The market front-runs this by 6–8 weeks.

December 8–9: First cut, 25bps. Fed funds to 3.25–3.50%.

What this means for BTC

The bottom window has pulled forward from Q4 2026 to June–August 2026. The market front-runs the September dovish pivot by 6–8 weeks — meaning BTC's cycle low is likely July–August, not Q4. The June 5 low at ~$59,200 may already be the cycle bottom.

This analysis is for informational purposes only and does not constitute investment advice.

GLT Seasonal Analysis: Why Summer 2026 Is Structurally Different
Four consecutive years of summer liquidity dips averaging 17–20 composite points. But 2026 breaks the pattern: QT ended December 2025, RMPs are adding ~$20bn/month, and no major TGA rebuild is expected.
Read full analysis →

The summer dip pattern (2022–2025)

Every year from 2022 to 2025, the RHCM GLT composite dropped approximately 17–20 points between the spring peak and the August–September trough. The seasonal index confirms August and September run ~18% below the annual average. This is driven by three mechanical forces: TGA rebuilds post-debt ceiling, QT monthly balance sheet drain, and thin summer trading volumes amplifying credit spread moves.

What's structurally different in 2026

QT ended December 1, 2025. The $60–95bn/month passive drain that suppressed the composite every prior summer is gone entirely.

RMPs are actively adding reserves. The Fed's Reserve Management Purchases are injecting ~$20bn/month. Reserves have risen $83bn since RMPs started in December.

No major TGA rebuild expected. The debt ceiling was resolved via OBBBA. The TGA is already at its $850bn target. Unlike 2023 ($600bn rebuild) and 2025 ($550bn rebuild), there is no large-scale summer drain event scheduled.

Revised seasonal projections

The seasonal trough is still real — summer always has lower liquidity than Q4. But the depth is structurally shallower. The composite floor is projected at ~44–47 rather than the historical ~40–42. July: 45–47 (+3–5 vs historical average). August: 43–46. September: 44–48. The Q4 recovery could be the strongest since 2020, with the composite potentially reaching 57–65 by December — driven by the seasonal tailwind, Warsh pivot narrative, and midterm political clarity all converging simultaneously.

This analysis is for informational purposes only and does not constitute investment advice.

TGA at $830bn — Could Bessent Front-Load a Summer Drawdown?
The Treasury General Account has already fallen $195bn from its April peak. With midterms in November and Bessent's explicit mandate to suppress yields, a deliberate drawdown would inject hundreds of billions in bank reserves.
Read full analysis →

The TGA as a liquidity tool

Every dollar the Treasury spends from the TGA becomes a bank reserve. This is a 1:1 mechanical relationship — no Fed involvement, no Congressional approval needed. It is pure cash management discretion. A $950 billion TGA drawdown can inject as much liquidity into markets as a couple of Fed rate cuts.

Current position

The TGA peaked at ~$1,025bn in late April and has already fallen to $830bn as of June 9 — a $195bn natural post-tax-season drawdown that has already injected reserves into the banking system. The TGA currently sits ~$230–430bn above the minimum operating buffer, giving Bessent significant room to draw down deliberately.

Three scenarios

Base case (natural seasonal): TGA falls to $600bn by September. +$230bn reserve injection. GLT composite impact: +3–4 points vs seasonal average.

Bessent active drawdown: TGA drawn to $400bn by August. +$430bn reserve injection. GLT composite impact: +6–8 points. BTC bottom June–July — may already be in.

Aggressive pre-midterm: TGA drawn to $250bn by July. +$580bn injection. GLT composite impact: +9–12 points. BTC bottom already confirmed.

The watch indicator

FRED series WDTGAL, published every Thursday at 4:30pm ET. If the TGA drops below $600bn before September, Bessent is deliberately front-loading stimulus. That is the signal the bottom is in or imminent — not the price of BTC itself.

This analysis is for informational purposes only and does not constitute investment advice.

CLARITY Act Impact: ETH as Commodity Changes Everything for BMNR
The White House is targeting a July 4 signing. If passed, ETH gains statutory commodity classification under CFTC jurisdiction, staking is explicitly excluded from securities law, and institutional custody frameworks unlock.
Read full analysis →

What the CLARITY Act does

The CLARITY Act codifies the March 17, 2026 joint SEC/CFTC interpretive release that classified Bitcoin, Ether, Solana, and XRP as commodities. It transforms agency guidance into statutory law — much harder to reverse than an executive order or regulatory interpretation. The CFTC gains exclusive jurisdiction over digital commodity spot markets, effectively removing ETH from the SEC's enforcement reach.

Five impacts on BMNR specifically

1. ETH as commodity: Institutional investors can hold ETH-backed equities like BMNR within existing commodity exposure frameworks. No SEC exemptions required.

2. Staking de-risked: The interim policy explicitly excluded staking from securities law. BMNR's MAVAN staking yield (~2.9% on 5.54M ETH) becomes a legitimate regulated income stream.

3. Institutional custody unlocked: Pension funds, endowments, and insurance companies can now access ETH treasury companies. This is a demand step-change.

4. ETH advantaged over rivals: Solana sits in a borderline category. Most "ETH killers" fail on decentralisation and insider control tests. Capital structurally redirected toward ETH-native treasuries.

5. Timeline: White House targets July 4 signing — 16 days from today. Prediction markets: 68%. Garlinghouse odds: 80–90%.

Model impact

CLARITY bull case: ETH target revised to $5,000, mNAV target to 2.0×. The ETH/BTC 0.0295 break (BMNR Tranche 2 trigger) could arrive in July rather than Q4.

The counter-signal

Q1 13F filings show institutions cut ETH sharply — JPMorgan −89%, Fidelity −84%, Goldman −62%. Possible "sell the news" dynamic. Institutions may re-enter post-signing via direct ETH custody rather than BMNR shares. Watch BMNR/ETHA relative strength post-signing.

This analysis is for informational purposes only and does not constitute investment advice.

Fidelity Divergence Signal: BTC at Power Law −49% Matches 2018 and 2022 Bottoms
Fidelity Research published a chart on June 7 showing BTC vs Power Law at −49% — the exact deviation that marked the 2018 and 2022 cycle bottoms. BTC/Gold Z-score at −100%, the most extreme reading in the dataset.
Read full analysis →

The Fidelity signal

On June 7, Fidelity Research published analysis showing BTC's deviation from the Power Law model at −49% — precisely matching the readings seen at the December 2018 and November 2022 cycle bottoms. This is not a proprietary or obscure indicator — it is Fidelity's institutional research arm identifying the same structural setup at the same deviation level for the third time.

BTC/Gold Z-score: most extreme ever

The BTC/Gold 52-week Z-score reached −100% — the most extreme reading in the entire dataset history. This measures how far BTC has underperformed gold relative to its own recent volatility. The reading exceeds both the 2018 and 2022 bottoms, making it the deepest value signal the ratio has ever produced.

The bullish divergence

BTC price briefly undercut the February 7 low, making a lower low in absolute price. But both the Power Law deviation and BTC/Gold Z-score printed higher lows — a textbook bullish divergence. Price went lower while the structural indicators showed the selling was less severe. Fidelity calls this a "successful retest."

What invalidates it

A weekly close below $55K with volume. That would breach the Power Law support in a way that differs structurally from the 2018 and 2022 setups. Until that happens, the divergence holds and the probability favours a recovery from the current zone.

This analysis is for informational purposes only and does not constitute investment advice.

MSTR Sold 32 BTC — First Sale Since December 2022. What It Means.
Strategy Inc sold 32 BTC on June 1 to fund preferred share distributions. The $2B perpetual preferred obligation creates ongoing cash drain at ~$750–800M annually. The capital structure question is now front and centre.
Read full analysis →

The sale

On June 1, Strategy Inc sold 32 BTC — the first BTC sale since December 2022. The sale was explicitly to fund preferred share distributions. At ~$63K per BTC, this raised approximately $2M — a tiny amount relative to the 847,363 BTC treasury, but symbolically significant as a break in the "never sell" narrative.

The capital structure pressure

MSTR's preferred stock obligations have grown to ~$750–800M annually. Cash reserves have declined to ~$900M from $2.25B at the start of 2026. There is a $1.01B convertible note maturing September 15, 2027 that requires MSTR stock above $183 for conversion — the stock is at $104. If BTC doesn't recover above ~$91,500 by then, Strategy may face forced BTC sales to repay the note.

The bear case

Average BTC cost basis has risen to $75,646. Total cost basis is $64.1B versus $51.9B in BTC value — the treasury is $12.2B underwater. The mNAV has collapsed to 0.67× basic. The acquisition machine thesis breaks if the equity issuance engine breaks, and issuing equity at 0.67× mNAV is deeply dilutive.

The bull case

CEO Phong Le bought shares on June 22 at the 52-week low. MSTR historically bottoms 4–6 months before BTC. At 0.67× mNAV, you are buying BTC at a 33% discount to spot through MSTR equity. If BTC recovers to $90K+, the capital structure pressure evaporates and the mNAV re-rates explosively — exactly as it did from 2020 to 2024.

This analysis is for informational purposes only and does not constitute investment advice.

ETH 77-Bar Cycle Model: Three Troughs at −116 and Counting
The RHCM Global Liquidity Tracker shows a precise 77-bar / 546-day periodicity in ETH — three consecutive intervals of 539, 539, and 553 days. The −116 GLT floor has been tested three times.
Read full analysis →

The 77-bar periodicity

On the weekly chart, ETH overlaid with the RHCM Global Liquidity Tracker reveals a strikingly regular cycle: three consecutive trough-to-trough intervals measuring exactly 77 bars / 539 days, 77 bars / 539 days, and 77 bars / 553 days. The average period is 543 days with only a 14-day variance — a 2.6% deviation across 1,600+ days of data.

What it measures

The 77-week cycle is almost exactly one-third of the Howell 65-month (~280-week) global liquidity cycle. ETH produces three mini-cycles of accumulation and expansion within each Howell macro cycle. This sub-harmonic resonance is not coincidental — liquidity injection cycles produce harmonic frequencies as capital rotates through asset classes at different speeds.

The −116 floor

The −116 level on the GLT scale is a structural accumulation floor — the point where ETH-specific liquidity pressure reaches exhaustion. It has been tested three times: December 2018, June 2022, and the current period. Each test was followed by a significant recovery. The consistency of this level across three cycles is the strongest signal that the current position is at or near the trough.

Trough 4 projection

The third 77-bar interval from the April 2024 trough points to approximately June–October 2026 as the current trough window. With ETH at $1,741 and the GLT at the −116 floor for the third time, the Warsh pivot thesis (July 29 FOMC) adds a macro catalyst that could mark the exact trough date. If the cycle holds its historical shape, a 200–250% recovery from the $1,388 low gives ETH targets of $4,000–$4,800 by H2 2027.

This analysis is for informational purposes only and does not constitute investment advice.

Get the weekly note

Every Monday morning — the GLT composite reading, key macro levels, and what I'm watching for the week. Delivered to your inbox.