Richmond Hill Capital Markets
Institutional-grade Pine Script indicators

Trade the liquidity cycle, not the headlines.

Our TradingView indicators built by an 20+ years European institutional finance practitioner with expertise in Quantitative finance. Howell global liquidity model, mNAV exit sequencers, and BTC cycle timing — the same tools I use to manage my own capital.

6
Indicators
42+
Live data points
3+
Central banks tracked
20+yr
Institutional experience
Fed + ECB + BoJ 4-CB Aggregate BTC 12-Week Liquidity Lag MSTR mNAV Live Proxy ETH/BTC ROC Deceleration SOFR / TGA / RRP Plumbing Stress Pi Cycle Top Auto-Detection MVRV Z-Score Integration HY/IG Credit Spread Monitor Liquidity & Price Action Trend Following Strategies Momentum Impulse IQ Fed + ECB + BoJ 4-CB Aggregate BTC 12-Week Liquidity Lag MSTR mNAV Live Proxy ETH/BTC ROC Deceleration SOFR / TGA / RRP Plumbing Stress Pi Cycle Top Auto-Detection MVRV Z-Score Integration HY/IG Credit Spread Monitor Liquidity & Price Action Trend Following Strategies Momentum Impulse IQ
The toolkit

Six indicators. One framework.

Every indicator is built on the same premise: asset prices follow global liquidity with a measurable lag. The toolkit gives you the liquidity read, the cycle position, and the exit signals.

Flagship
Global Liquidity Tracker v2.6
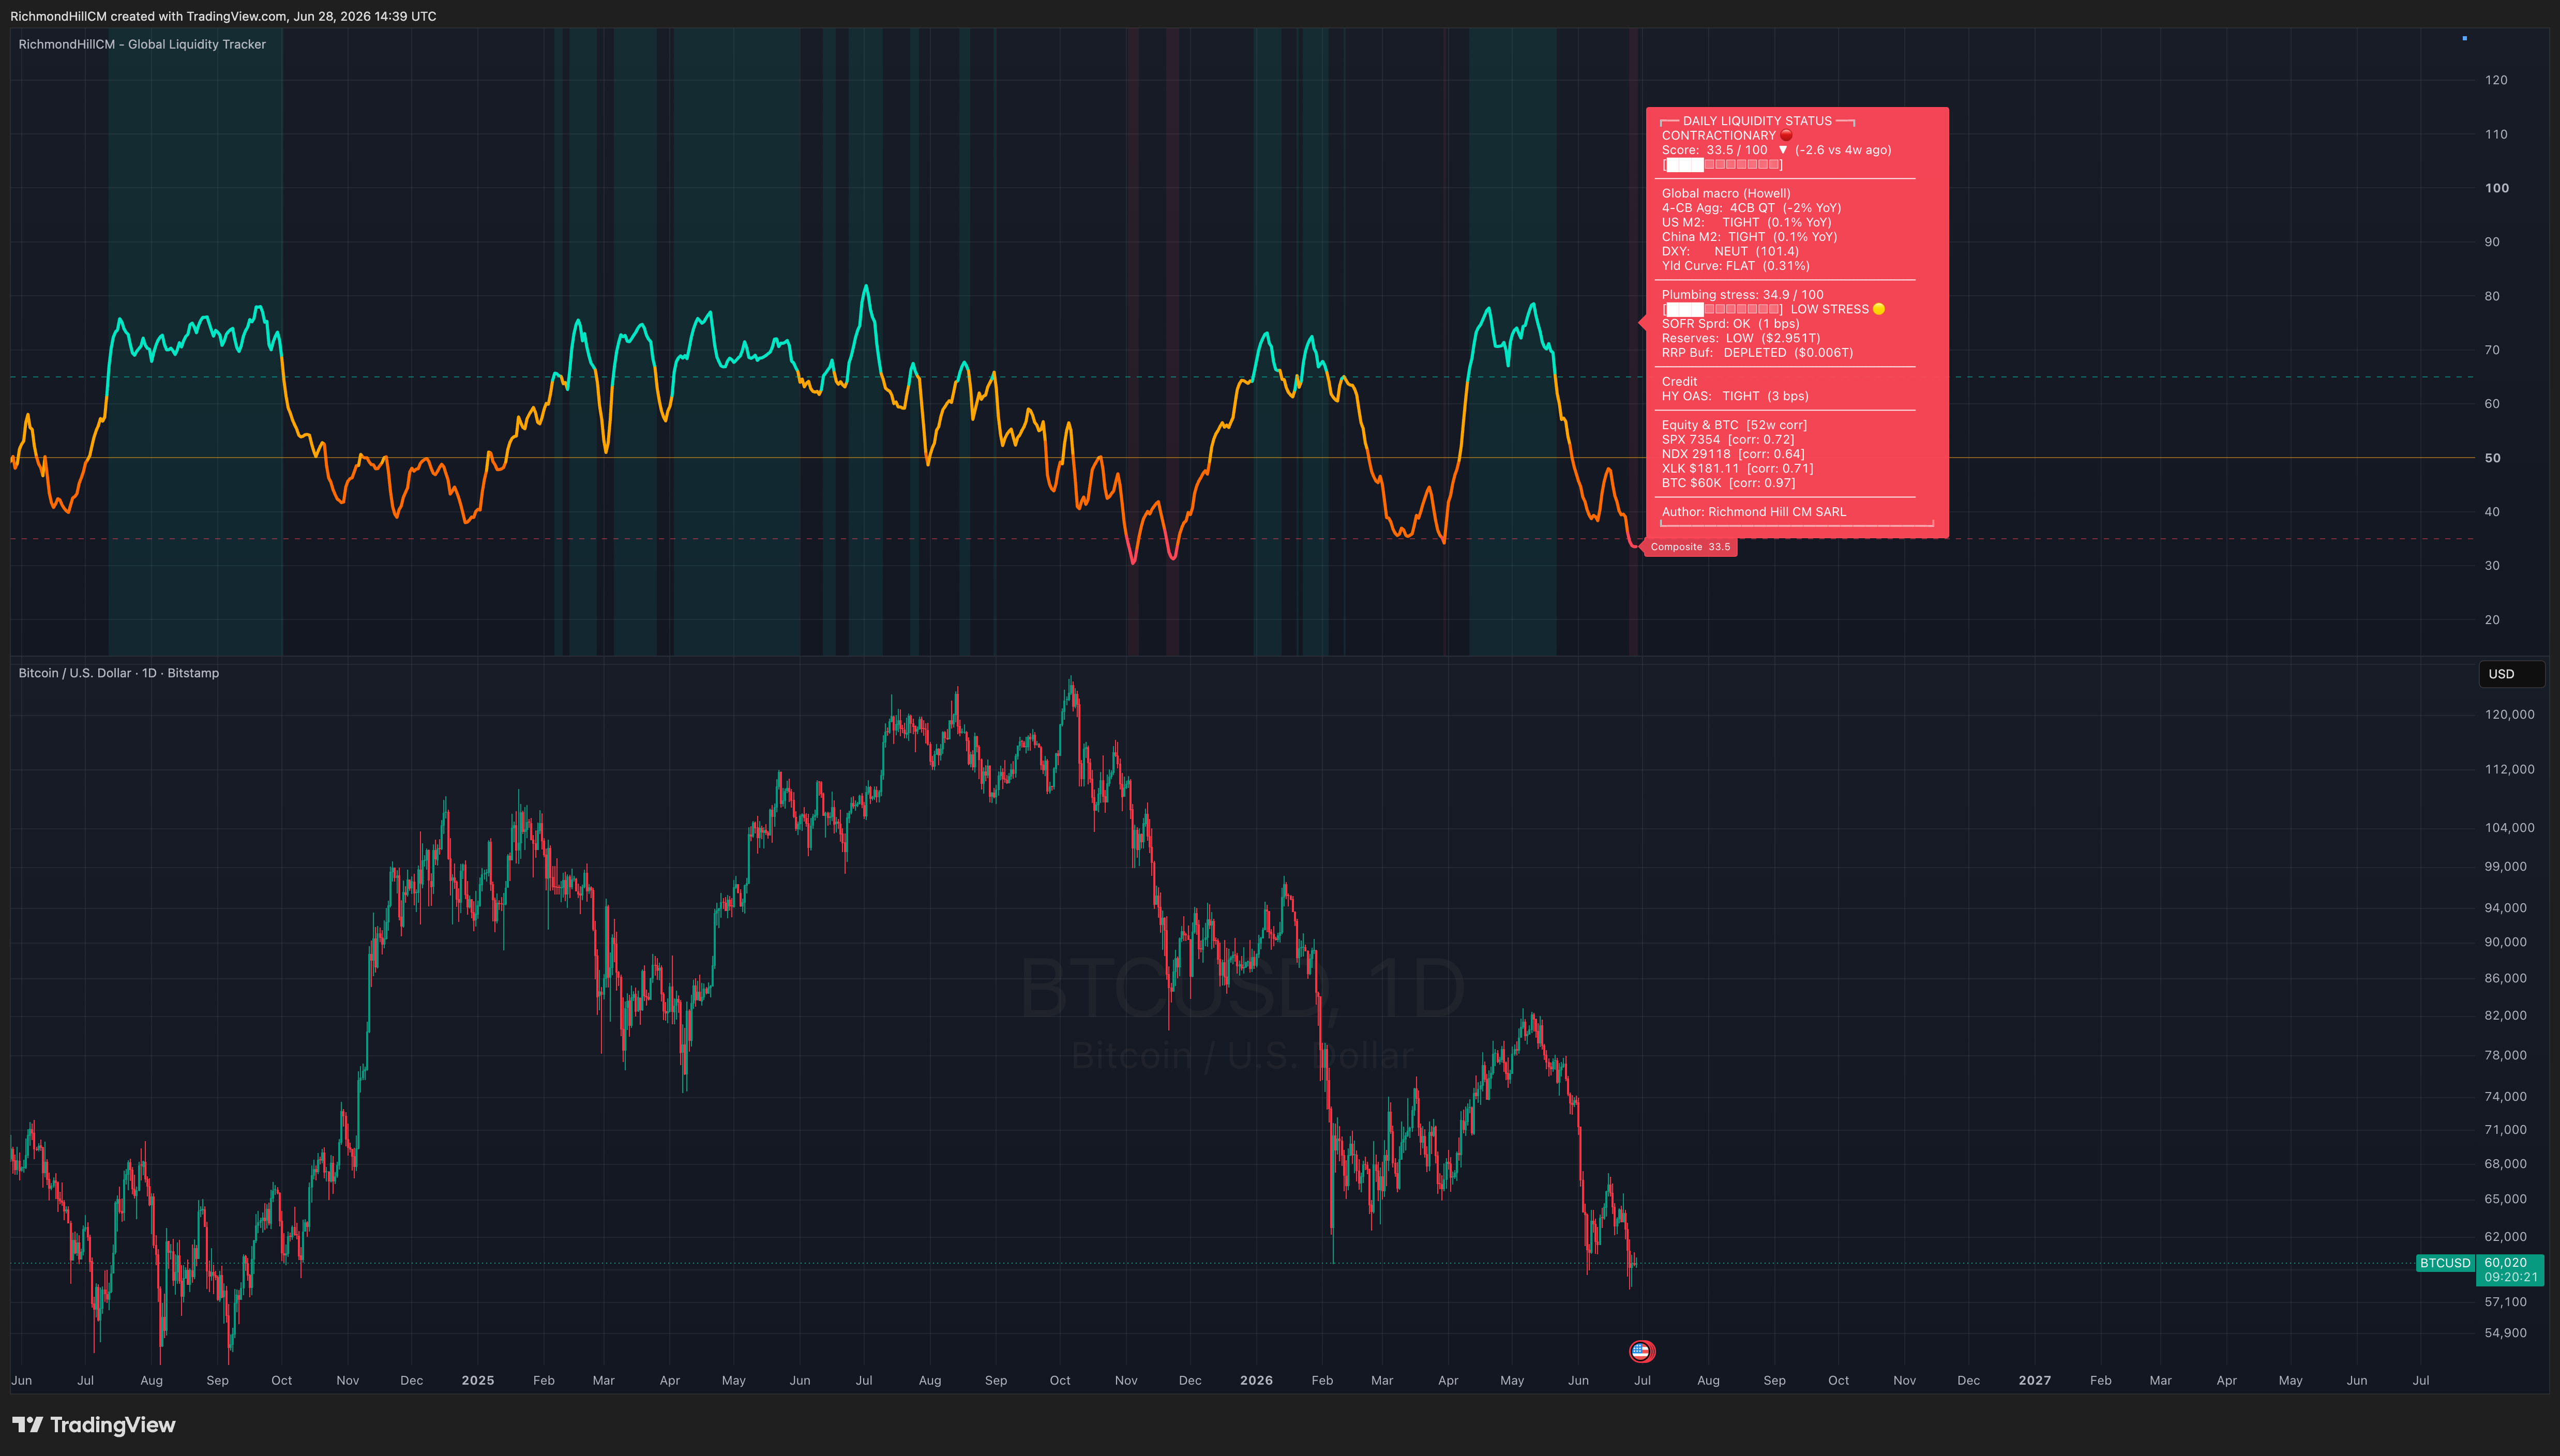
RichmondHillCM Global Liquidity Tracker v2.6 — TradingView chart showing composite score, BTC overlay, plumbing stress, and 42-row dashboard
📊

GLT v2.6 Screenshot

Replace with: images/glt-screenshot.png

A 4-central-bank aggregate liquidity model aligned to Howell / CrossBorder Capital. Composite score, US plumbing stress, BTC/equity correlations, and a 42-row real-time dashboard.
  • Fed + ECB + BoJ & BoC balance sheets (USD-normalised)
  • SOFR / TGA / RRP / Reserves plumbing stress monitor
  • BTC 12-week lag + equity 8-week lag correlations
  • HY/IG credit spreads with causal chain analysis
  • Master composite (0–100) with 4-regime classification
  • 3-tier alert system: Watch → Warning → Crisis
LIQUIDITY & PRICE
Liquidity & Price Action V1.3
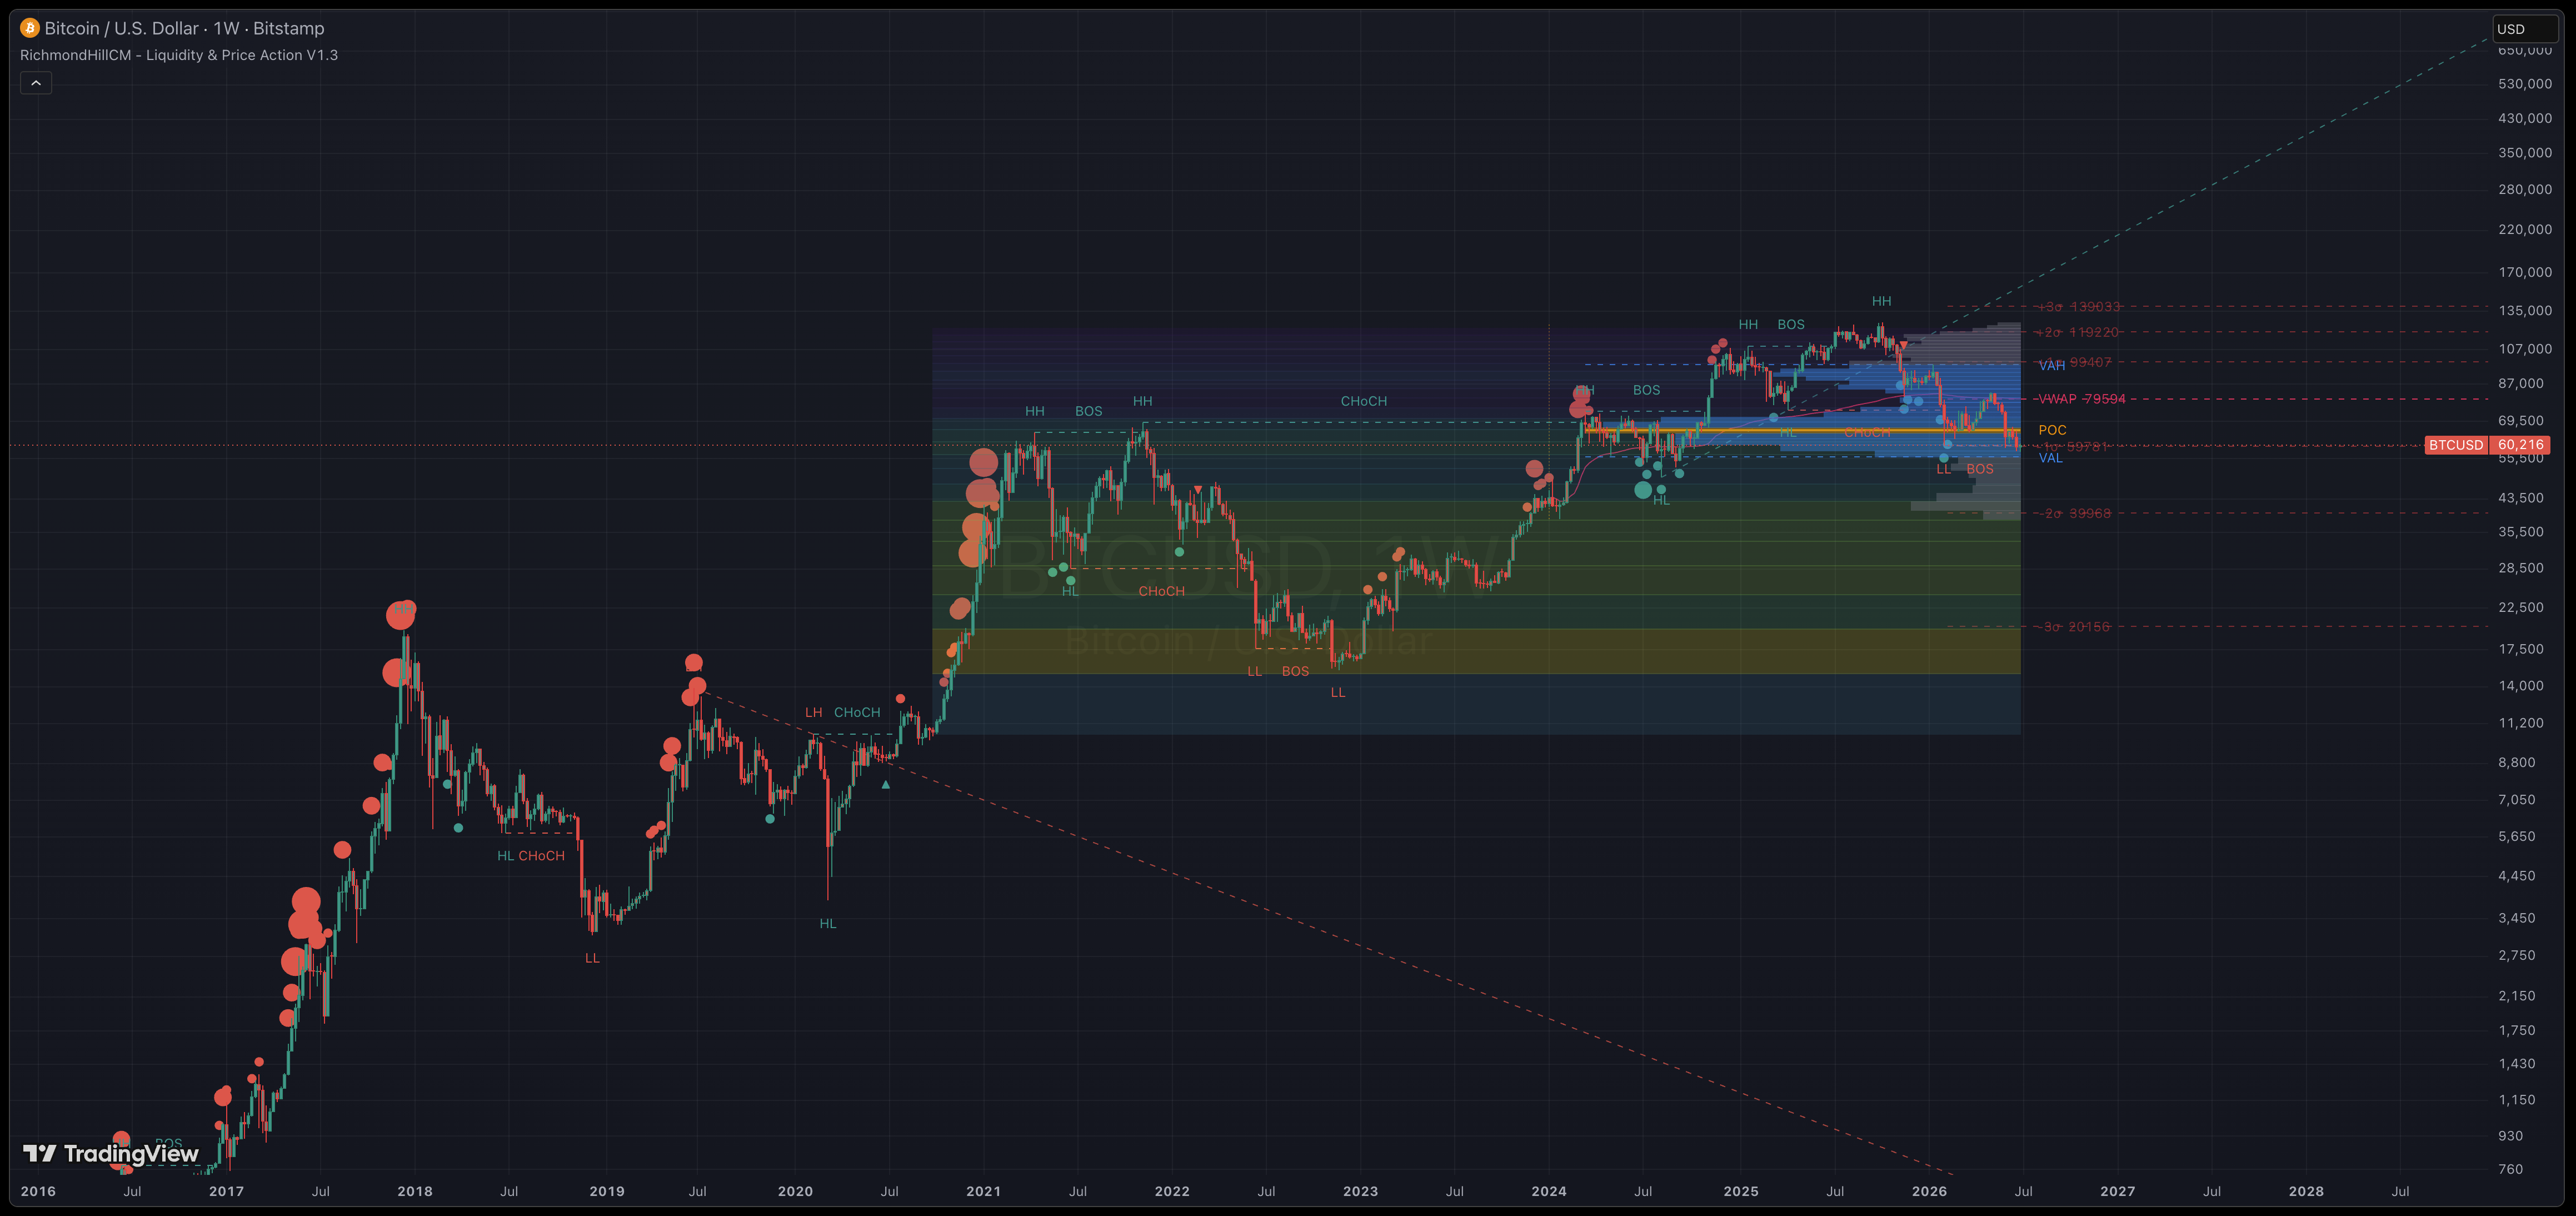
RHCM Liquidity & Price Action — anchored volume profile, VWAP bands, market structure
📊

Liquidity & Price Action Screenshot

Replace with: images/liquidity-screenshot.png

Confluence-first entry framework for any liquid market. Anchored volume profile, VWAP standard-deviation bands, automated market structure, and a pre-defined limit-order ladder.
  • Market Structure — auto HH / HL / LH / LL with live BOS / CHoCH
  • Anchored Volume Profile — POC and 70% value area measured
  • Anchored VWAP — mean, dashed order level, ±1σ / 2σ / 3σ bands
  • VWAP Entry Band + Ladder & spaced limit rungs (ATR / % / fixed)
  • Read structure, volume, and mean-reversion from one overlay
  • Liquidity Heatmap & FOMO Bubbles
Trend Following
Directional Trend Bias V1.1
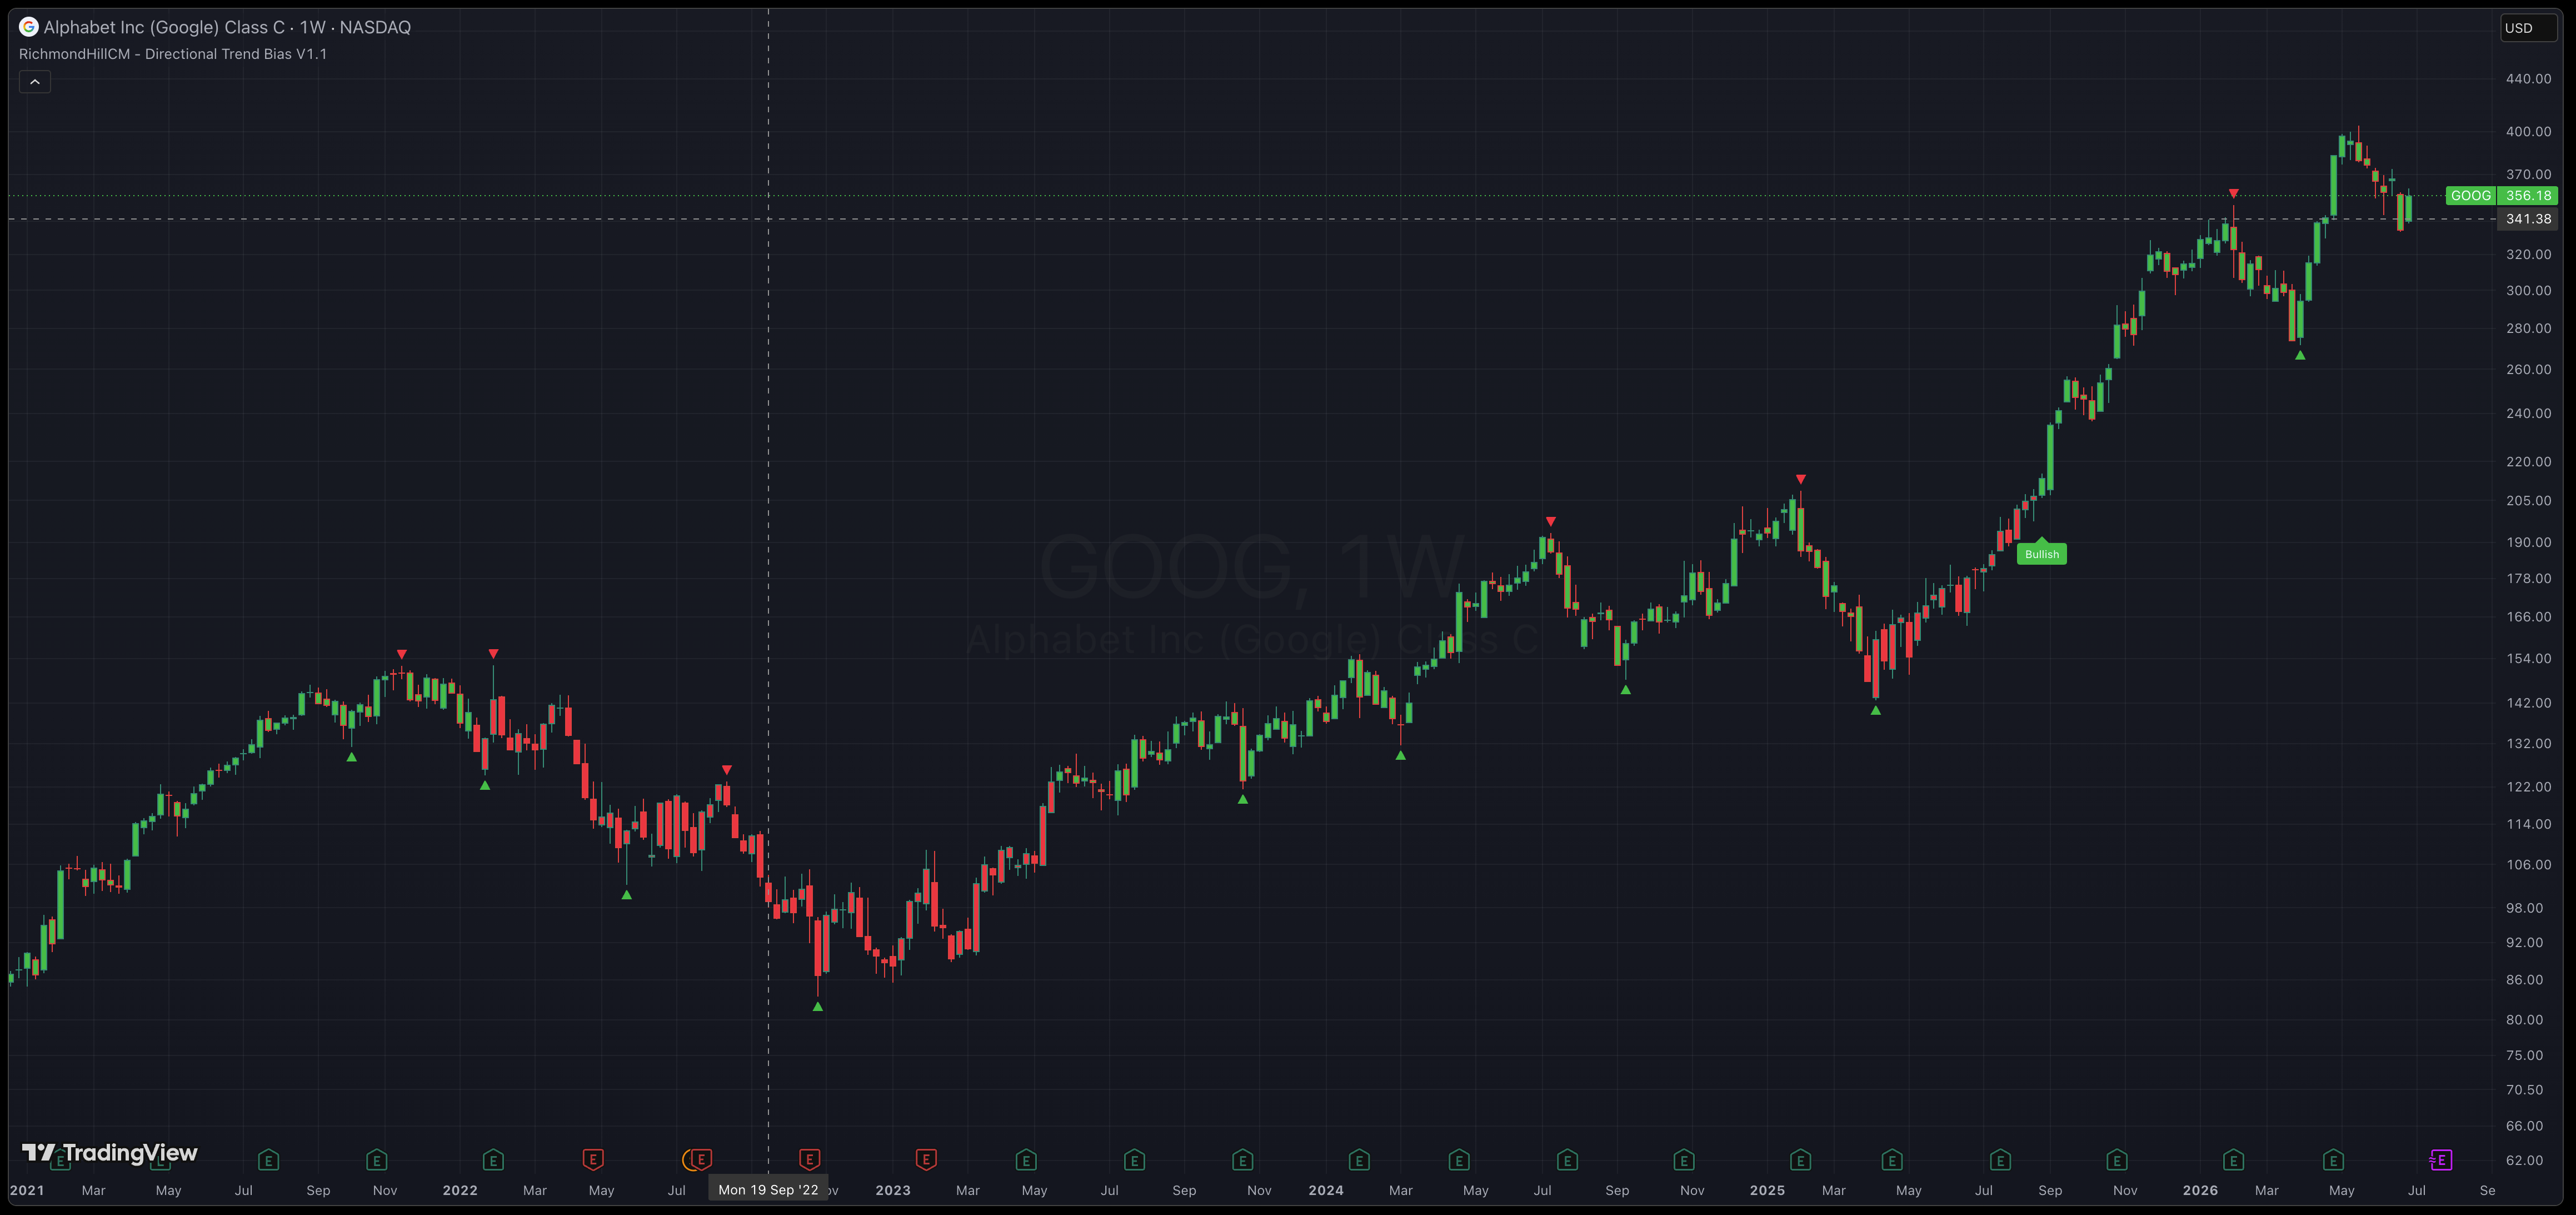
RichmondHillCM - Directional Trend Bias V1.1
📊

Directional Trend Bias V1.1

Replace with: images/TrendBias.png

Structure-first trend framework for any liquid market. Live swing-pivot detection, automatic bias flips, and clean color-coded candles built for fast visual reads.
  • Market Structure — auto swing high/low detection
  • Bias-Colored Candles — bullish, bearish, and neutral
  • Swing Point Markers — every confirmed pivot plotted
  • Adjustable Sensitivity — one lookback setting scales
  • Flip Alerts — built-in alert conditions
  • Fully Custom Palette — candle, background, and labels
Momentum Impulse
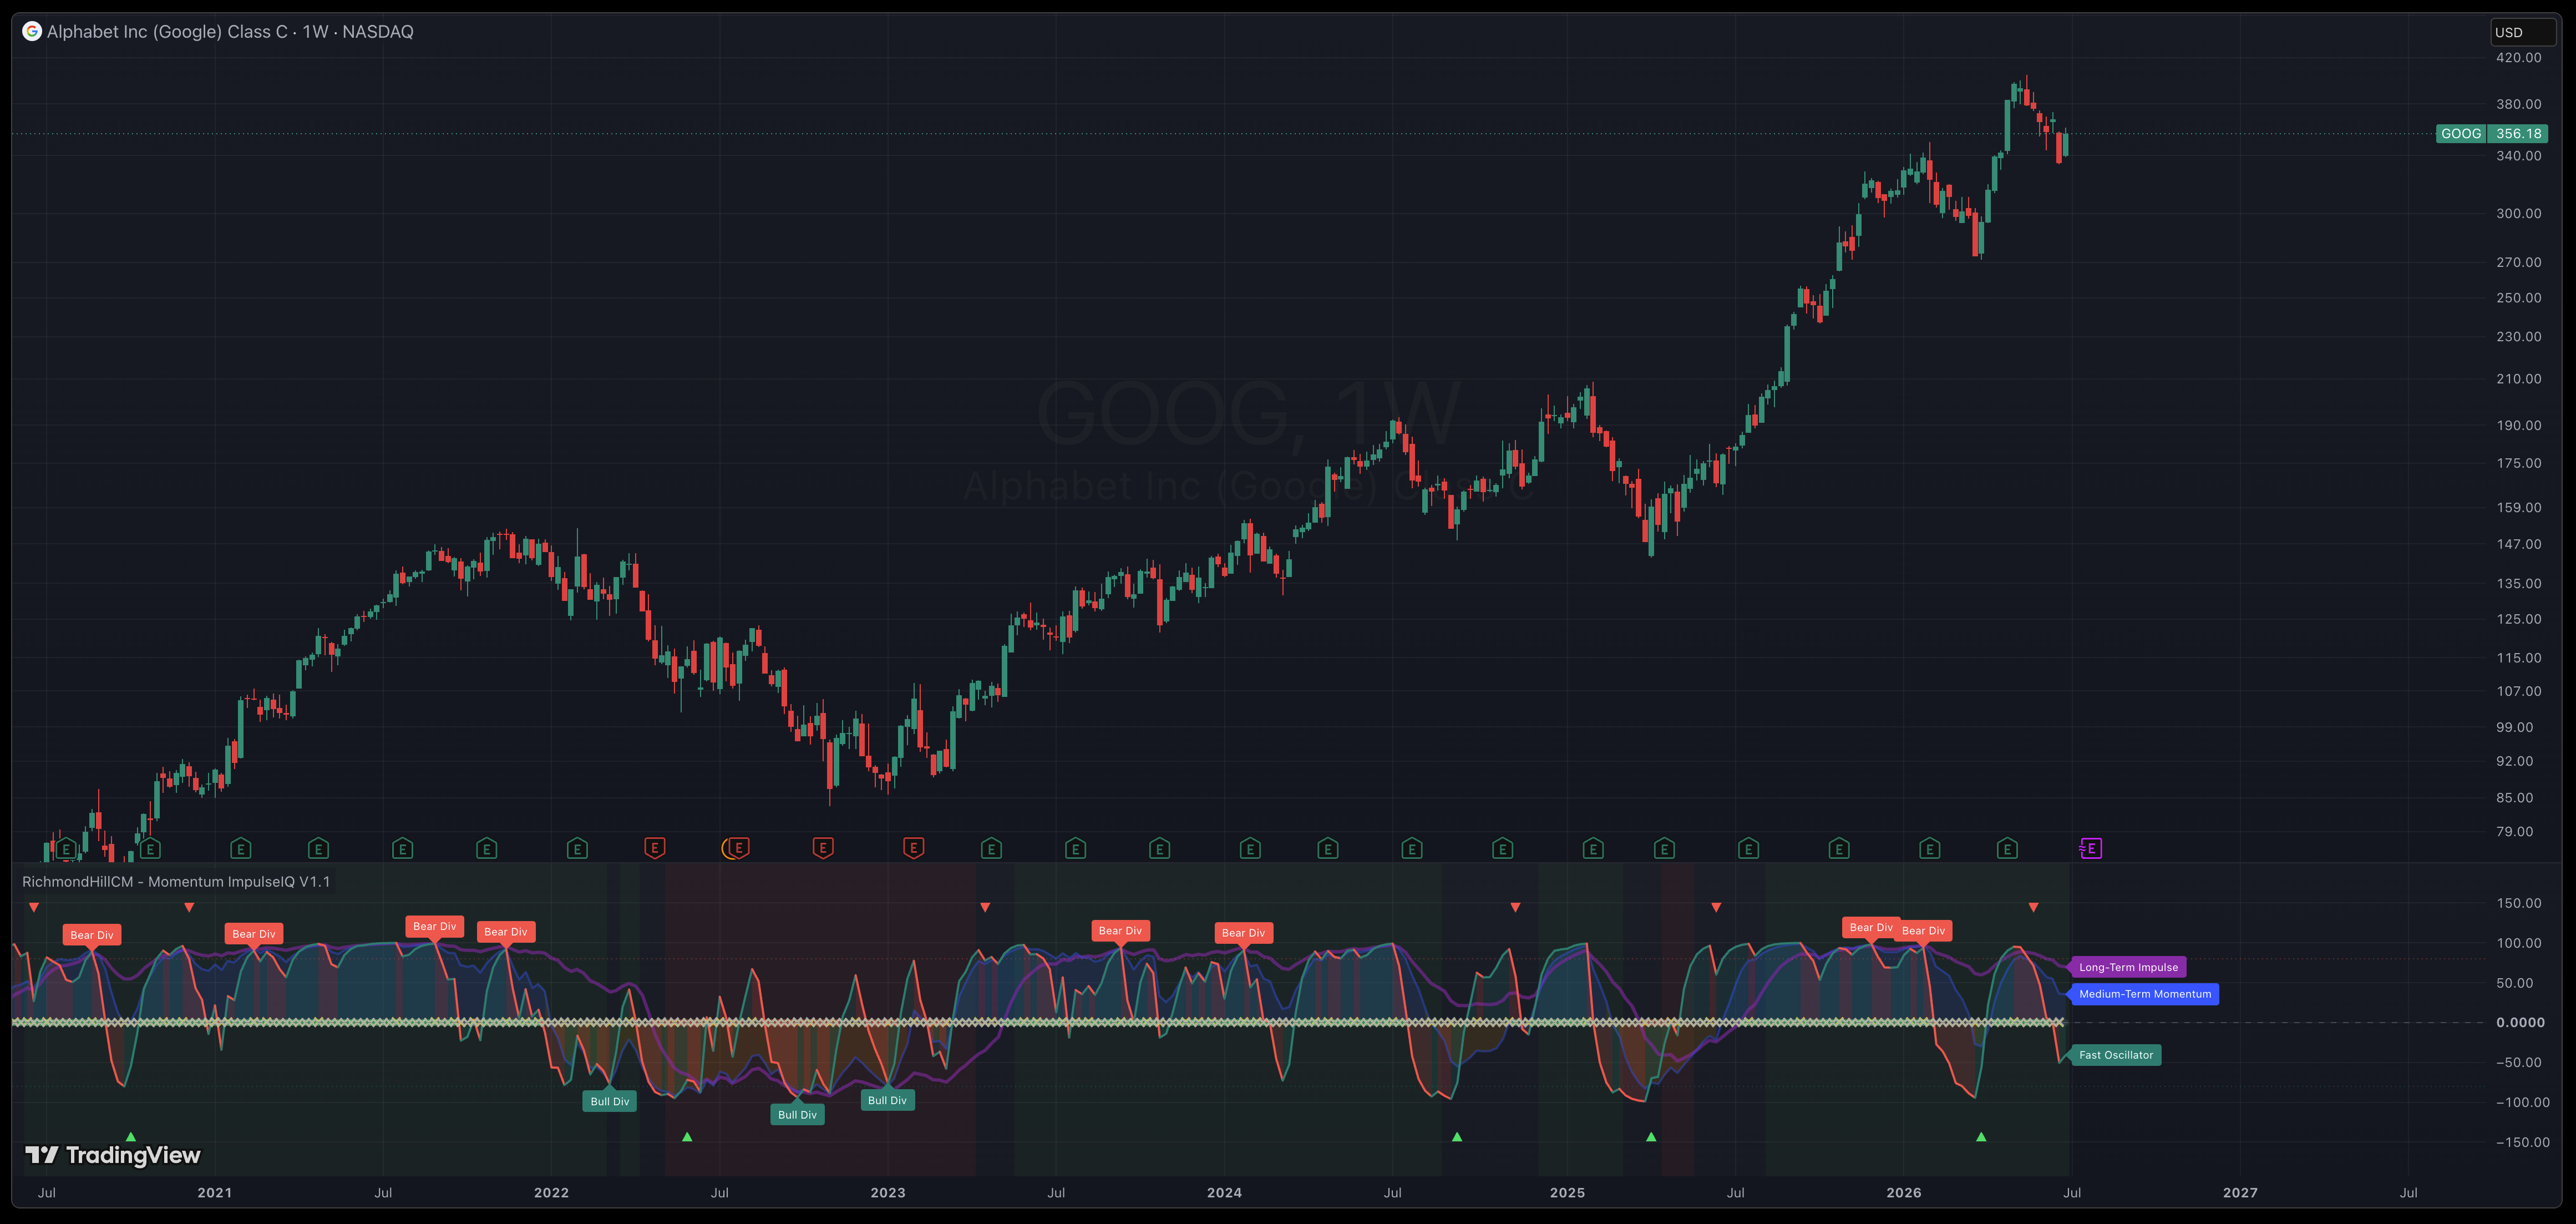
Momentum ImpulseIQ V1.1
📊

Momentum ImpulseIQ V1.1

Replace with: images/MomentumImpulseIQ.png

Multi-layer momentum framework for reading short-, medium-, and long-term momentum from a single pane. Normalized oscillators, regime-gated divergence and reversal signals, and automated trend/range detection.
  • Fast Oscillator — normalized short-term momentum
  • Divergence Detection — bullish / bearish divergences
  • Reversal Signals — overbought / oversold flips
  • Diminishing Momentum Warning — flags
  • Momentum Confluence Marker — visual cue
  • Auto-Labeled Curves & Built-In Alerts
Multi-Asset Dashboard
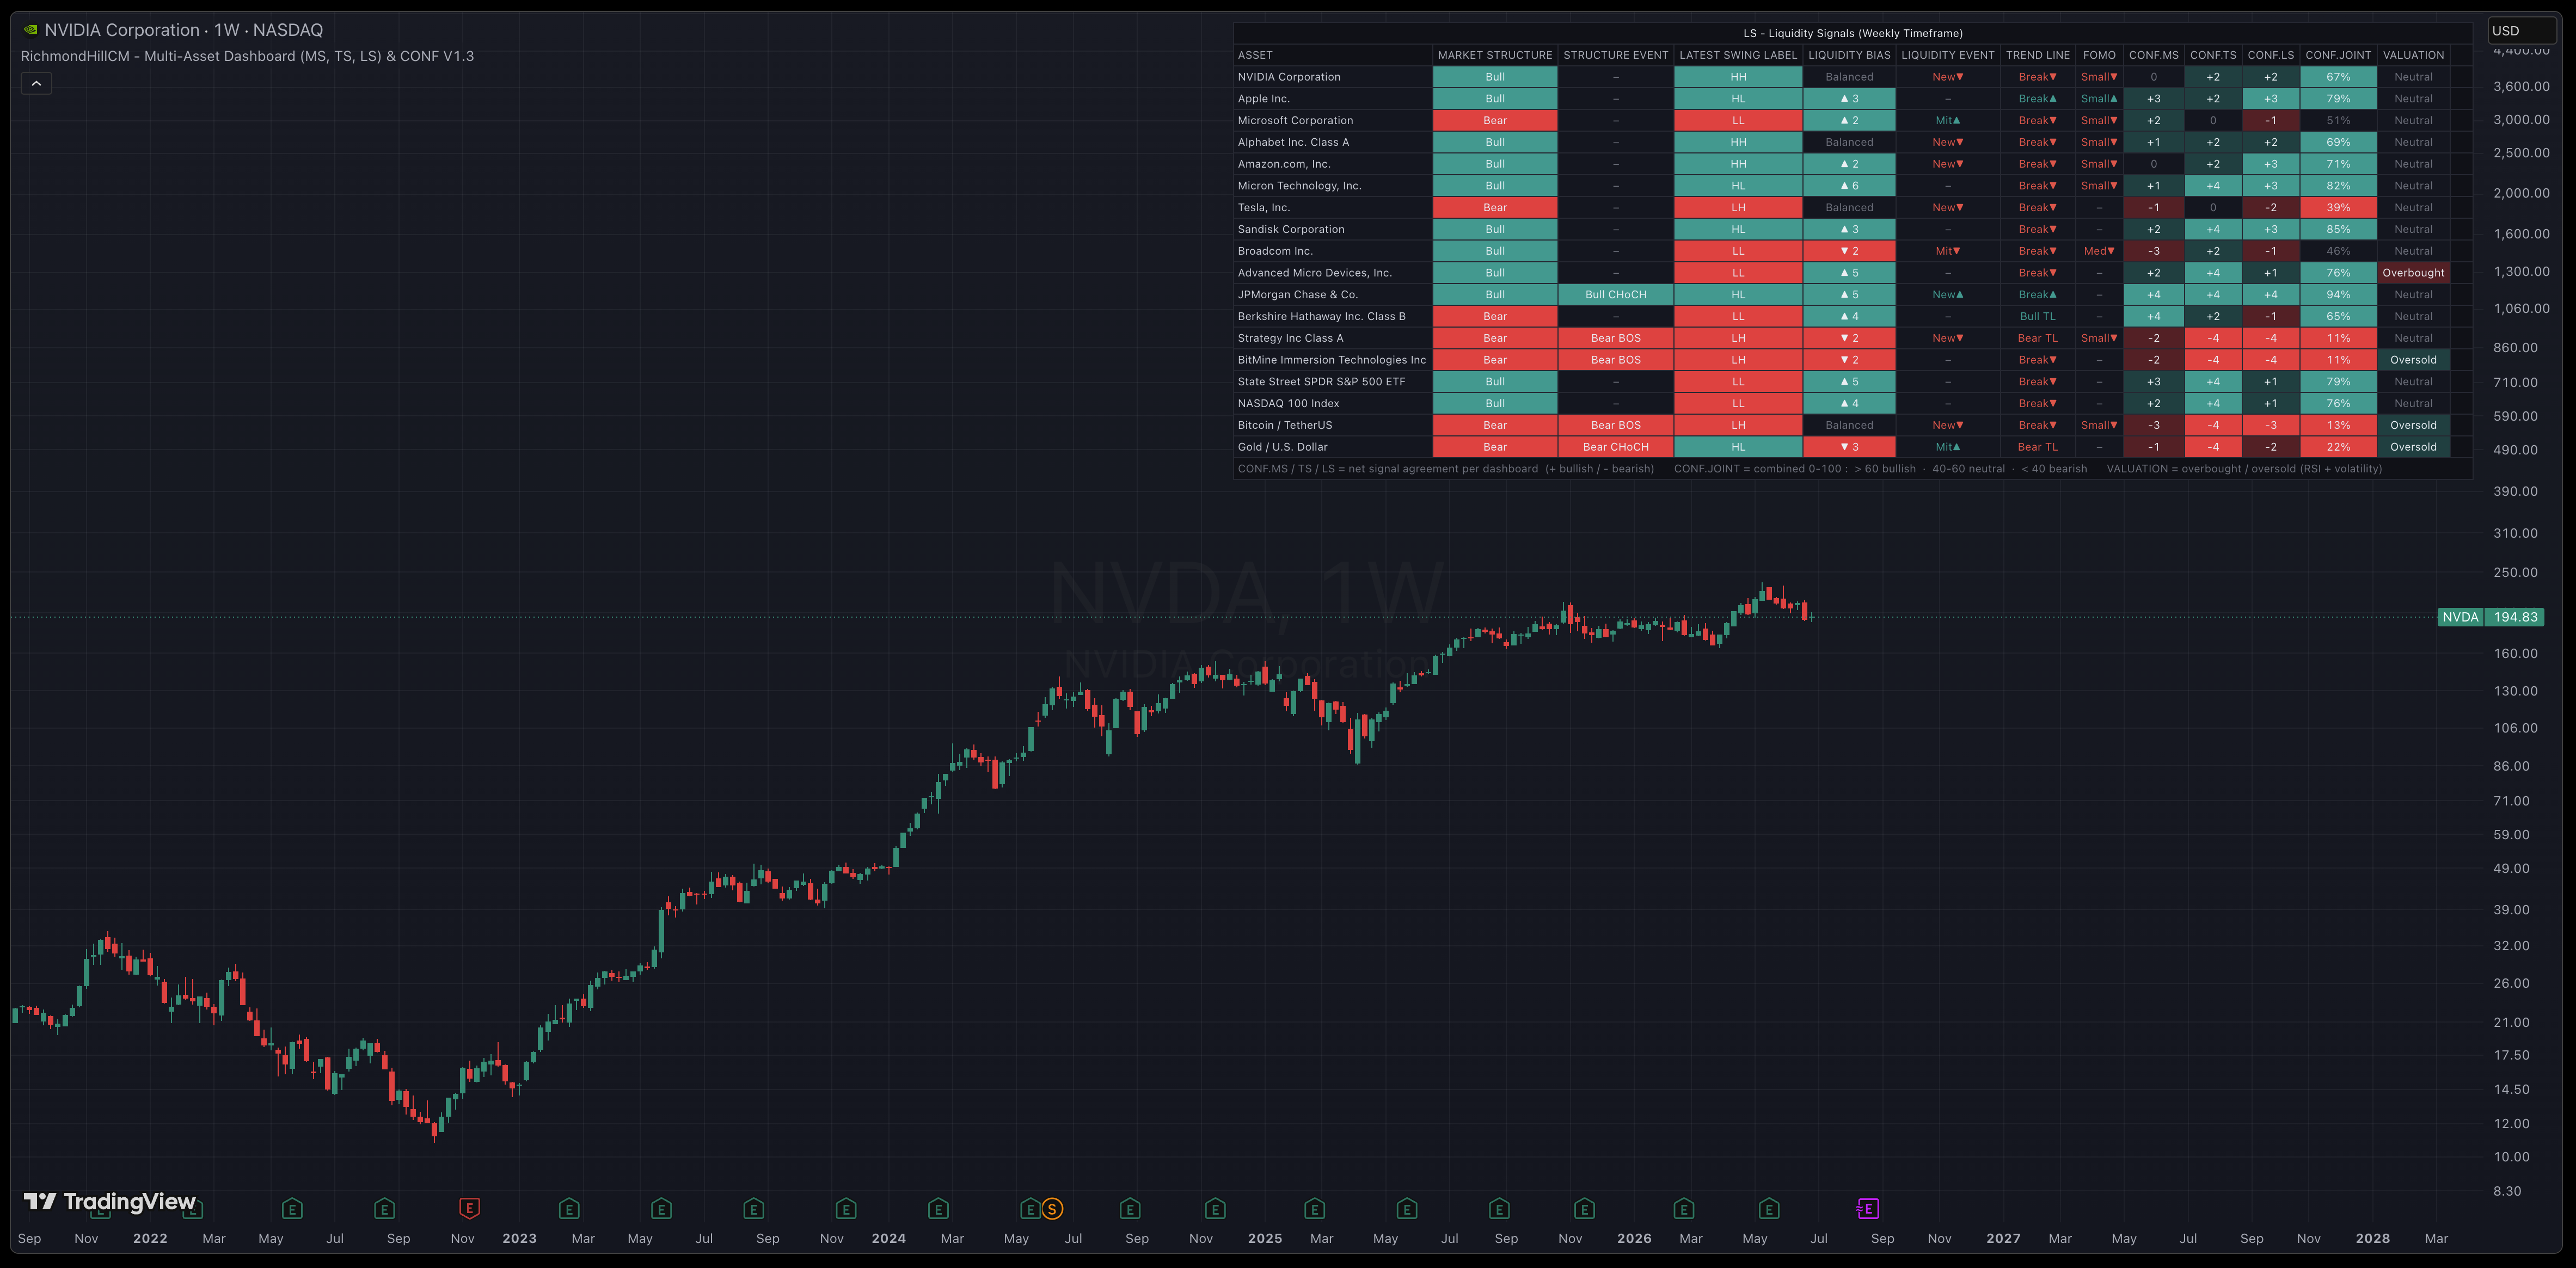
Multi-Asset Dashboard (MS, TS, LS) & CONF V1.3
📊

Momentum ImpulseIQ V1.1

Replace with: images/MADashboard.png

Single-pane multi-symbol screener for reading momentum, trend and liquidity across up to 18 assets at once. Always-on confluence scoring, a combined 0–100 joint reading and overbought / oversold valuation surface the strongest aligned setups without switching charts.
  • Three Dashboards — momentum, trend & liquidity in one/li>
  • 18-Symbol Watchlist — scan a whole market at a glance
  • Confluence Scoring — per-dashboard signal agreement
  • Joint Score (0–100) — one combined bullish / bearish read
  • Valuation Column — overbought / oversold detection
  • Auto-Labeled Curves & Built-In Alerts
Pulse Algo
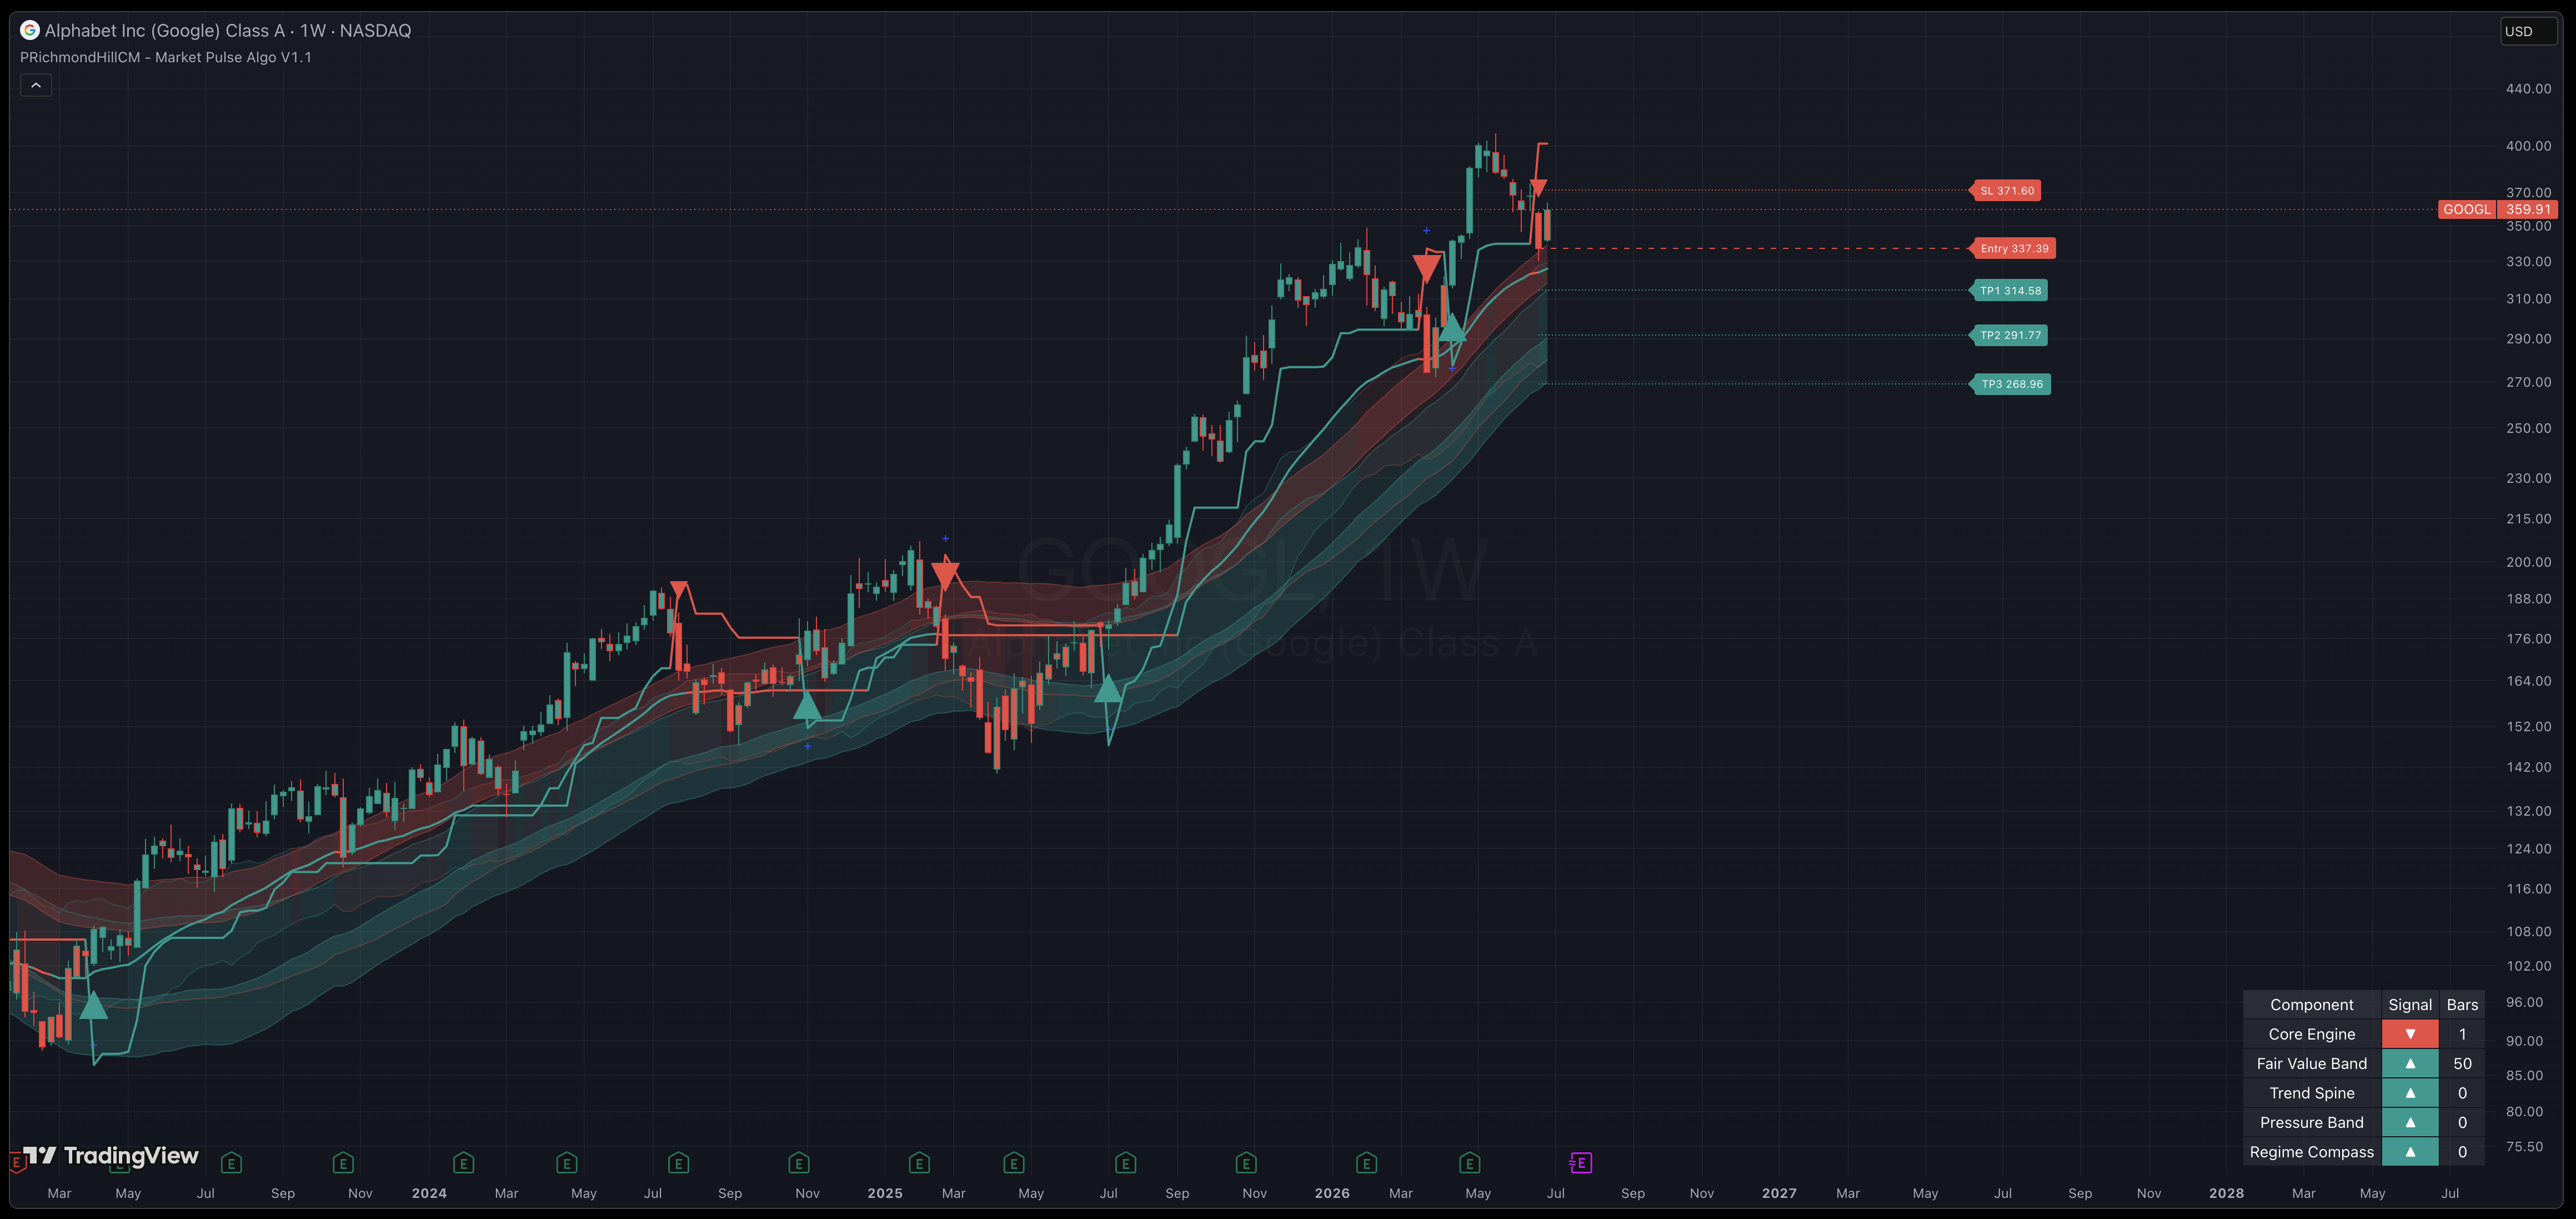
Market Pulse Algo V1.1
Momentum ImpulseIQ V1.1
📊

Momentum ImpulseIQ V1.1

Replace with: images/MarketImpulseAlgo.png

Modular trend engine for any liquid market. One core signal generator with five stackable confluence layers, automated trade levels, and a live status table built for fast, at-a-glance decisions.
  • Core Engine — ATR trailing stop or EMA+RSI pulse mode/li>
  • air Value Band — volume-weighted zone marking stretched
  • Trend Spine — momentum-filtered backbone
  • Pressure Band — visualizes accelerating or decelerating momentum in real time
  • Volatility Cloud — adaptive support/resistance zones
  • Auto TP/SL Levels — entry, stop, and three targets plotted
Security-specific

Built for BTC · MSTR

Purpose-built exit sequencers for the assets that follow the liquidity cycle most closely. Each indicator tracks the specific premium, ratio, or cycle metric that drives that security — not generic technicals.

BTC Cycle
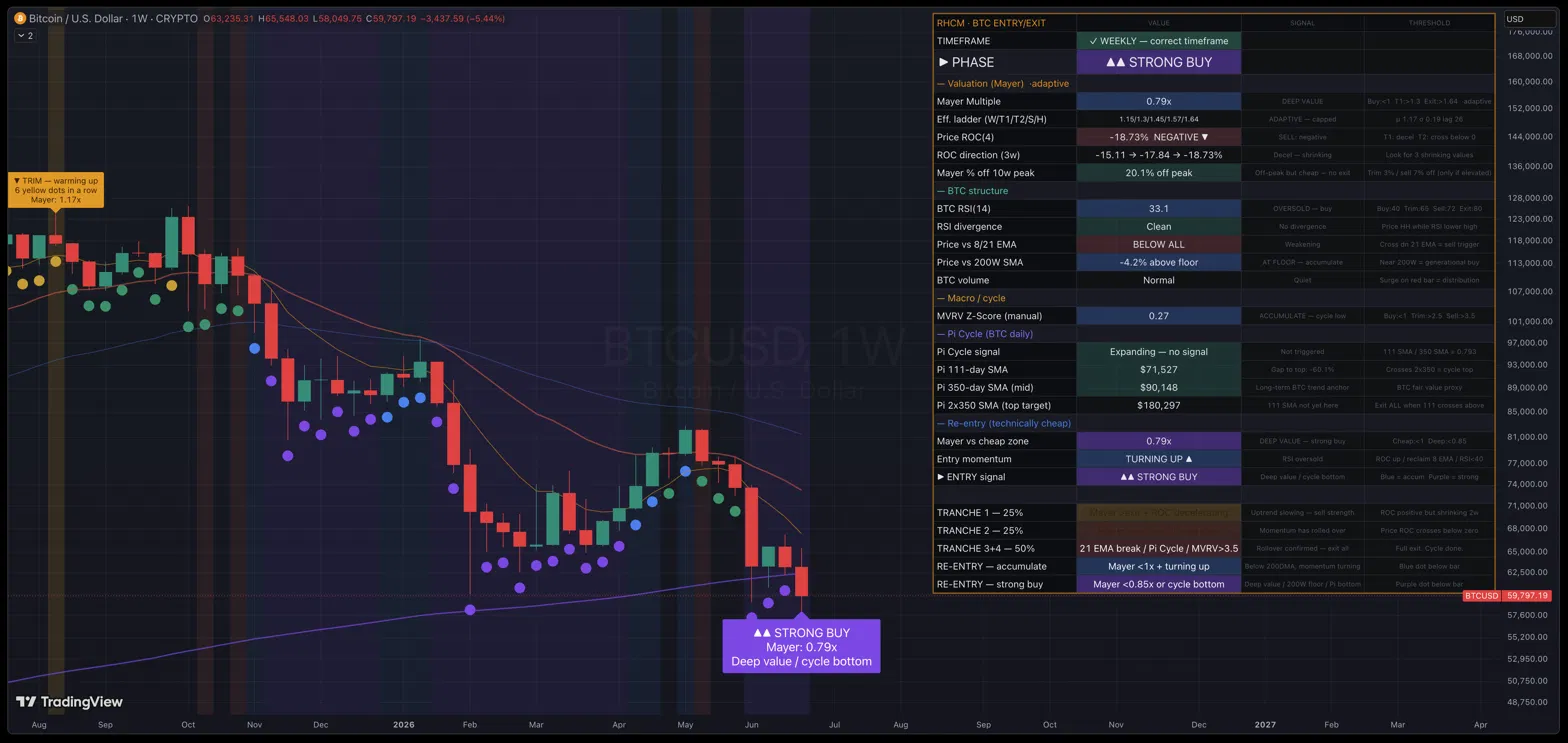
BTC Entry/Exit Strategy V1.3
RHCM BTC Exit Strategy — weekly chart with Pi Cycle Top, MVRV zones, TST detector dots, and 4-tranche sell ladder
📊

BTC Exit Screenshot

Replace with: images/btc-exit-screenshot.png

Momentum-first exit strategy for Bitcoin. Pi Cycle Top auto-detection, MVRV Z-Score, NUPL thresholds, and a weekly TST (successful retest) detector — pre-defined 4-tranche sell ladder.
  • Pi Cycle Top — live 111 SMA / 2×350 SMA crossover
  • MVRV Z-Score integration (manual weekly update)
  • Weekly TST detector — 2/2 confirmed at prior cycle bottoms
  • 4-tranche exit ladder with pre-defined sell levels
  • Dot colour system: green / yellow / red on every candle
MSTR
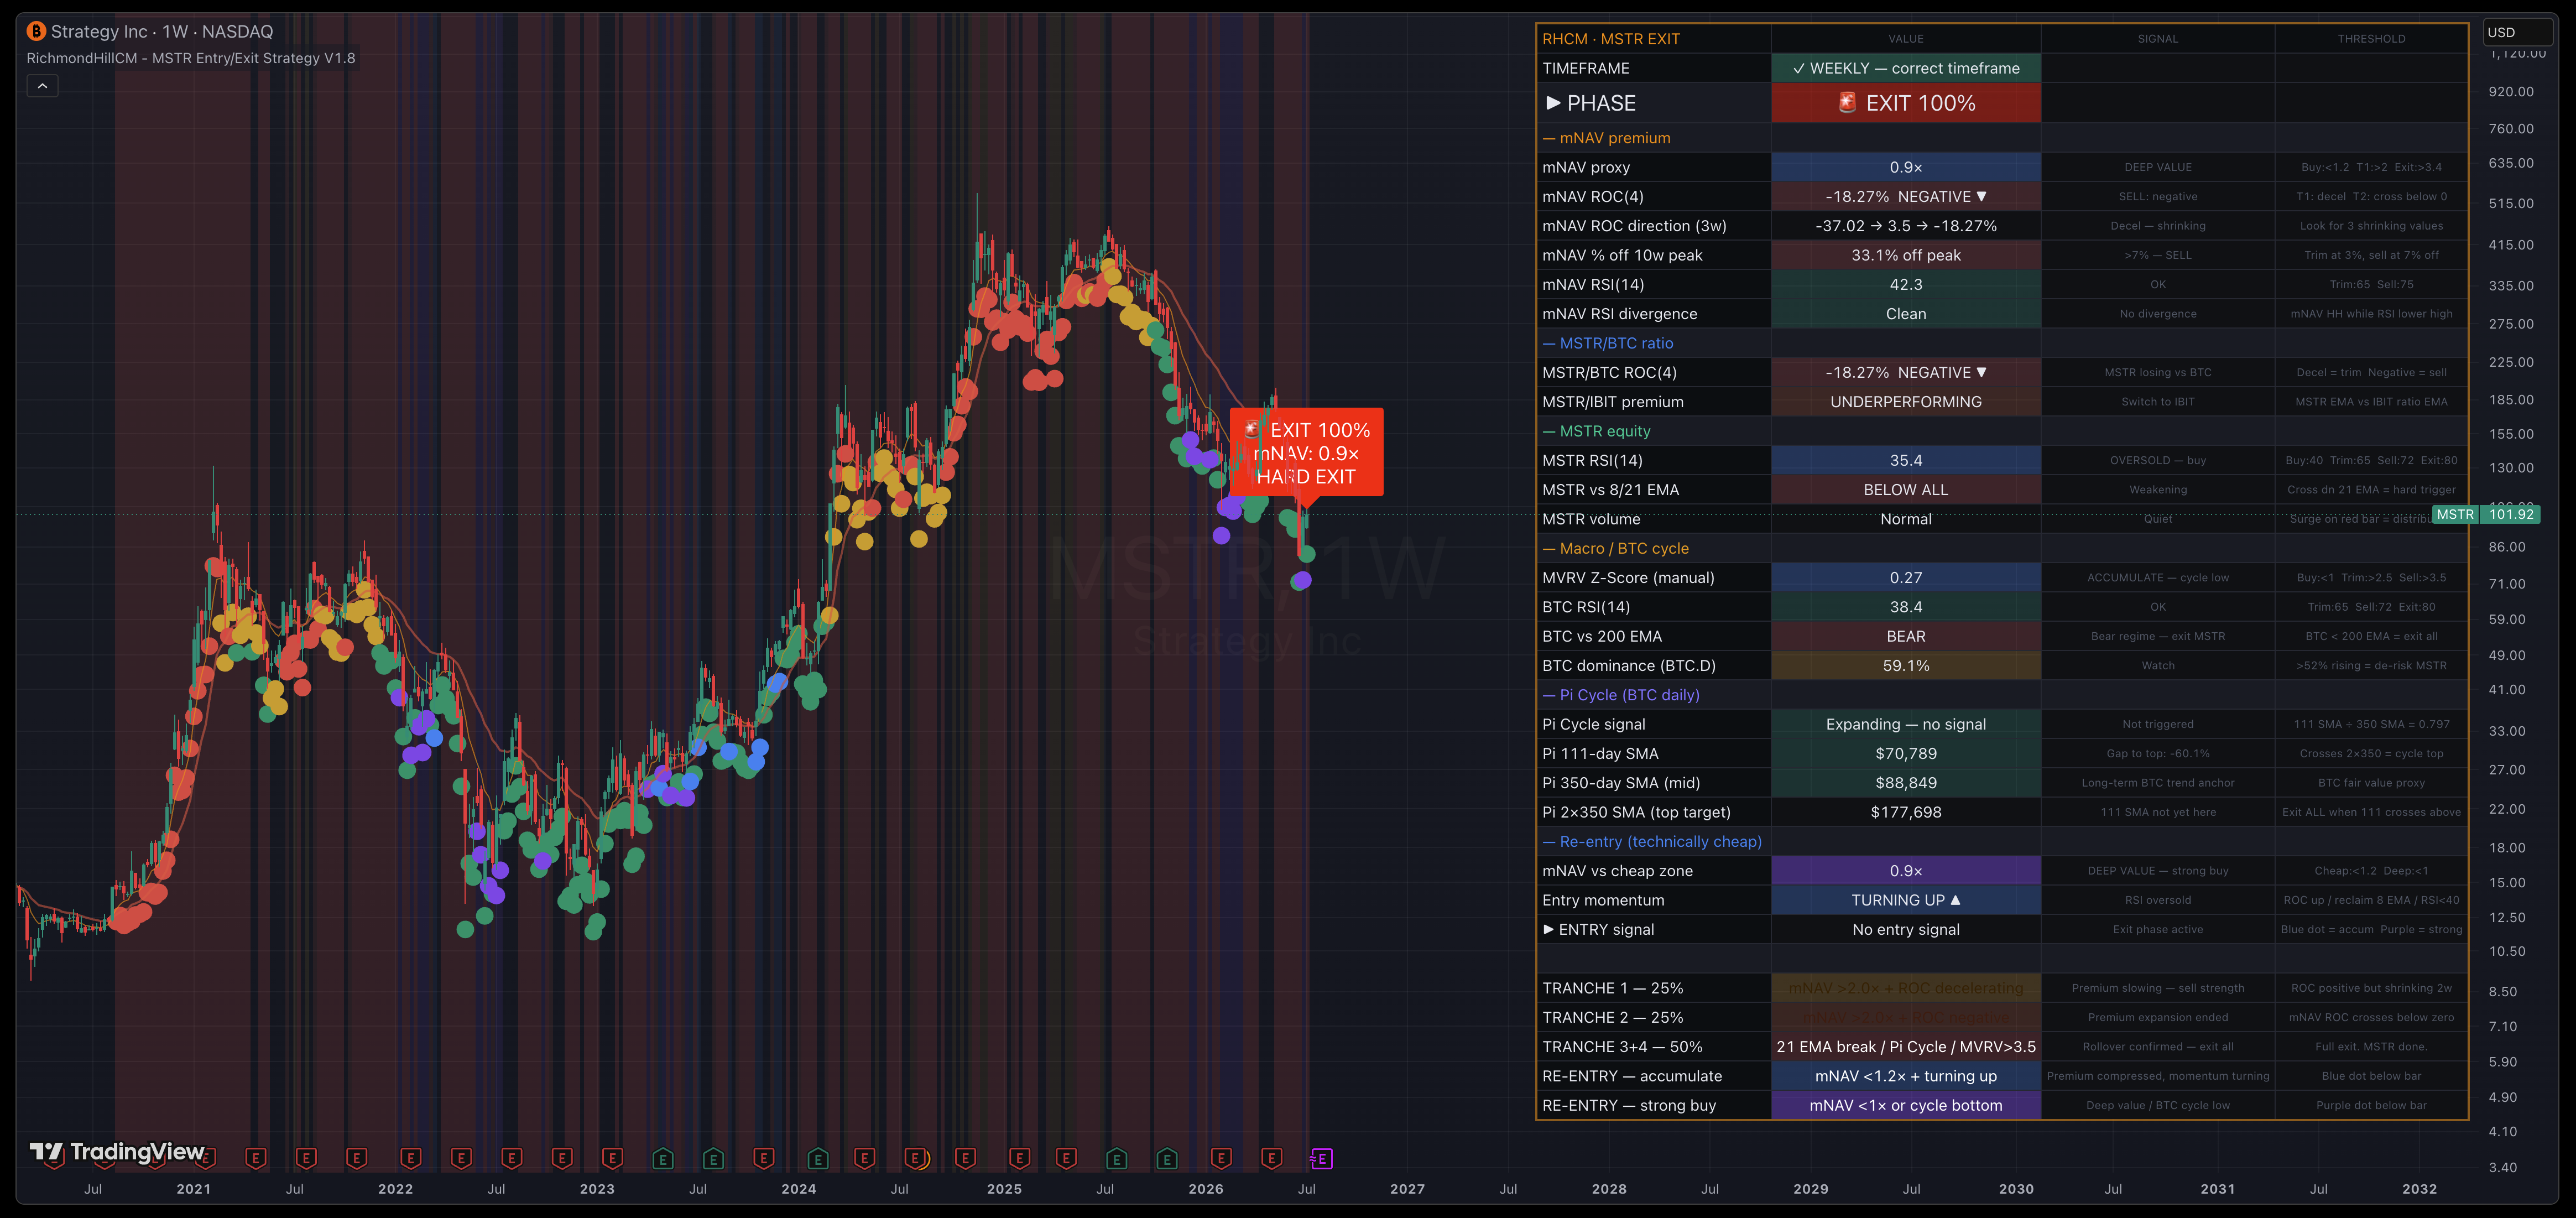
MSTR Entry/Exit Sequencer V1.8
RHCM MSTR Exit Sequencer — weekly chart with live mNAV proxy table, ROC deceleration, Pi Cycle rows, and tranche ladder
📊

MSTR Exit Screenshot

Replace with: images/image-3.png

Purpose-built for Strategy Inc positions. Live mNAV proxy from BTC per share, ROC deceleration detection, MSTR/BTC outperformance tracking — knows when the premium is peaking.
  • Live mNAV proxy — auto from BTC per share input
  • mNAV ROC deceleration: 3-bar trend displayed in table
  • MSTR/BTC ratio ROC + MSTR vs IBIT relative strength
  • Pi Cycle + MVRV for macro BTC cycle timing
  • Tranche ladder: Trim 1 → Trim 2 → Sell → Hard Exit
How it works

From subscribe to chart in under 5 minutes.

Your source code is never visible. You get full functionality — TradingView runs the compiled indicator on your chart. I never see your data, positions, or trading activity.

01
Subscribe
Choose your plan. Monthly or annual. Payment via PayPal — card, bank, or PayPal balance. Cancel anytime.
02
Share your username
After payment you'll be asked for your TradingView username. I add you to the invite list within 24 hours (usually within a few hours).
03
Add to your chart
Search "RichmondHillCM" in TradingView's indicator search. All indicators in your plan appear. Add them to any chart. Done.
04
Set your alerts
Each indicator has pre-built alert conditions. Set them once — TradingView sends you mobile/email/webhook notifications. Check your chart once a week.
Pricing

One framework. Simple pricing.

A free tier to try the composite. One paid tier that gives you everything. No upsells, no tiers for individual indicators, no hidden costs.

Free
$0 / month
The GLT composite line and BTC overlay. Enough to see if the framework works for you.
  • VWAP & Volume-Spike Suite V1.3
  • Liquidity Stress Index V 1.2
  • Log-Price Regression Channel V1.2
  • PTJ Regime Change
  • Alert conditions
  • Global Liquidity Tracker v2.6
  • Security-Specific Models - Built for BTC & Others
  • Weekly macro update note via email
  • Discord community access
Add to TradingView — free
Annual
$690 / year
Two months free. Same access as Professional. Locked price for 12 months.
  • Everything in Professional
  • Save $258 vs monthly (27% off)
  • Price locked — no increase for 12 months
  • Priority support responses
Subscribe — $690/yr →
Who builds this

Our Team

Richmond Hill Capital Markets is built by a team of quantitative finance professionals with deep institutional experience across European central banking, investment banking, and hedge fund strategy. We combine macro liquidity research with systematic trading frameworks to build tools that institutional and sophisticated retail investors can rely on.

Our founder is a Senior Investment Adviser based in Luxembourg with over 20 years of experience in global financial markets, having worked with investment banks and hedge funds developing quantitative models.

RHCM is my personal multi-strategy firm spanning real estate co-investment, listed equities, and digital assets. These indicators are the tools I built to manage my own capital. I publish them because no existing TradingView indicator properly implements the Howell global liquidity framework with live central bank data and US plumbing stress monitoring.

I don't sell signals. I don't run a trading room. I build analytical frameworks, explain the logic behind them, and let you draw your own conclusions.

  • 20+ years European institutional finance
  • European Central Bank — Research Analyst
  • Lewtan Technologies - Quant Modeler
  • MBA Finance · MSc Statistics · BA Engineering
  • Luxembourg licensed: promoter, agent, portfolio manager
  • Howell / CrossBorder Capital framework practitioner
  • Self-directed multi-asset portfolio since 2008
💬

Join the RichmondHillCM Discord

Weekly macro discussion, GLT readings, indicator Q&A, and direct access to the author. Free for all subscribers.

Join Discord →
Questions

FAQ

Can you see my source code after I subscribe?
No. Indicators are published as "invite-only" on TradingView. You add them to your chart and they work fully, but the source code is never visible — not a single line. TradingView compiles and runs it server-side. This is a standard TradingView feature, not something I control.
What TradingView plan do I need?
The GLT uses multiple external data feeds (FRED, FX, equities) so you need at least a TradingView Plus plan for the full version. The exit sequencers work on any plan including free. All indicators are Pine Script v5.
How quickly do I get access?
Within 24 hours of sharing your TradingView username — usually within a few hours during European business hours. You'll receive a confirmation email once access is granted.
What do I need to update manually?
The GLT is fully automatic — all data feeds are live. The MSTR exit sequencer needs BTC per share updated monthly (from Strategy's 8-K filings — I include this in the weekly note). The MVRV Z-Score is a manual weekly input from Glassnode.
Are these trading signals?
No. These are analytical tools. They tell you what liquidity regime you are in and where momentum is accelerating or decelerating. They do not tell you to buy or sell. You make all trading decisions yourself. This is not investment advice.
Can I cancel anytime?
Monthly subscriptions cancel at end of billing period — no questions asked. Annual subscriptions are non-refundable but you retain full access for 12 months. When your subscription ends, TradingView access is removed at the next billing cycle.
Do you share the Pine Script source code?
No. The indicators are invite-only, which means the compiled script runs on your chart but the source code is never visible. This protects the proprietary logic — the Howell weighting model, plumbing stress calculations, and ROC deceleration algorithms — while giving you full indicator functionality.
What is the Howell framework?
Michael Howell of CrossBorder Capital identified a ~65-month global liquidity cycle driven by central bank balance sheets, M2 money supply, cross-border capital flows, and credit conditions. BTC follows this cycle with a ~12-week lag. The GLT implements this framework with live FRED data and extends it with US plumbing stress monitoring.
Get started

Subscribe to the RichmondHillCM toolkit.

Fill in your details, select a plan, and pay securely via PayPal — all without leaving this page.